


How to Create a One Variable Data Table in Excel?

Do you need help understanding how to create a one variable data table in Excel? Excel is an incredibly powerful tool, and while it can be intimidating, you can quickly learn the ins and outs of the program with a few simple steps. In this article, we’ll provide you with a step-by-step guide on how to create a one variable data table in Excel, so you can make the most of this powerful program. With this guide, you’ll be able to quickly get started and create a data table in Excel in no time. Let’s get started!
- Start with the formula in a cell. This formula will be used to calculate the results.
- Identify the variable that you want to change. This will be the input cell of the data table.
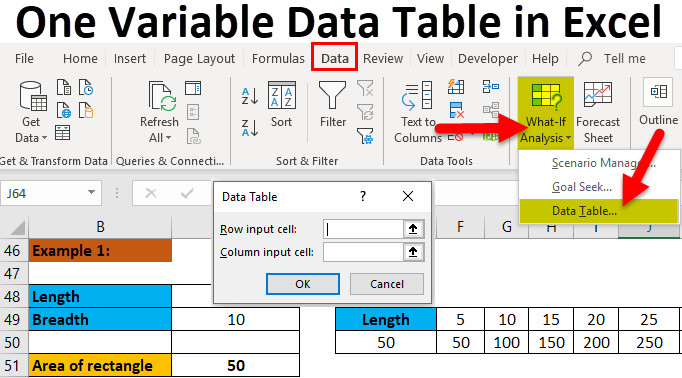
- Select the cell where the formula is located, then select the Data tab and click on “What-If Analysis” and select Data Table.
- In the Data Table dialog box, enter the cell reference of the input cell in the Column Input Cell box.
- Click OK, and Excel will display the data table.
Introduction to Creating a One Variable Data Table in Excel
Creating a one variable data table in Microsoft Excel is a great tool to use when you need to analyze different scenarios that involve one input variable. This type of data table allows you to quickly see how changing the value of one variable affects the output of another variable. In this article, we will go over the steps to create a one variable data table in Excel.
Understanding Input and Output Variables
Before creating a one variable data table in Excel, it is important to understand the difference between an input variable and an output variable. The input variable is the variable that is being changed, while the output variable is the variable that is being calculated based on the input variable. In a one variable data table, there is only one input variable and one output variable.
Identifying Input and Output Variables
The first step in creating a one variable data table in Excel is to identify the input and output variables. The input variable should be placed in the first column of the table, while the output variable should be placed in the second column. The input variable should also be labeled as such, while the output variable should be labeled as well.
Setting Up the Table
After the input and output variables have been identified, the next step is to set up the table in Excel. To do this, select the range of cells for the table and then click on the “Data” tab. Then, click on the “Data Table” button in the “What-if Analysis” group. This will open the “Data Table” dialog box, which allows you to specify the input and output variables.
Inputting Variables into the Table
Once the input and output variables have been identified and the table has been set up in Excel, the next step is to input the variables into the table. This can be done by entering the values for the input variable into the first column and then entering the formula for the output variable into the second column. The formula should reference the input variable, so that the output will be calculated based on the value of the input variable.
Adding Labels to the Table
Once the input and output variables have been inputted into the table, the next step is to add labels to the table. This can be done by entering the labels for the input and output variables into the first row of the table. This will help to make the table more readable and easier to understand.
Testing the Table
Once the input and output variables have been entered into the table and the labels have been added, the next step is to test the table. To do this, enter different values for the input variable into the first column and then check to make sure that the output variable is calculated correctly. This will help to ensure that the table is working properly.
Formatting the Table
The final step in creating a one variable data table in Excel is to format the table. This can be done by selecting the range of cells for the table and then clicking on the “Format” tab. In the “Format” tab, you can select the desired formatting options, such as font size, font color, background color, etc. This will help to make the table more visually appealing and easier to read.
Once the table has been formatted, it is ready to be used. With a one variable data table, you can easily analyze different scenarios that involve one input variable.
Few Frequently Asked Questions
What is a One Variable Data Table?
A one variable data table is a type of spreadsheet in Excel that allows you to see the results of a calculation for a range of different inputs. For example, you might use a one variable data table to calculate mortgage payments for different loan amounts over different terms. The table will automatically calculate and display the result for each combination of inputs.
What is Needed to Create a One Variable Data Table in Excel?
Creating a one variable data table in Excel requires two things. First, you need to have a formula that will calculate the result for different inputs. Second, you need to create two columns of data: one for the input values and one for the results of the calculation. Once these are in place, you can use the Data Table feature to create the one variable data table.
How Do I Create a One Variable Data Table in Excel?
Creating a one variable data table in Excel is a simple process. First, enter the formula that will calculate the result for different inputs in the first cell of the data table. Next, select the two columns of data that contain the input values and the results of the calculation. Finally, click the Data tab and select the Data Table option, then enter the input values in the dialog box that appears.
What are the Benefits of Using a One Variable Data Table in Excel?
Using a one variable data table in Excel has several benefits. First, it allows you to quickly and easily compare different inputs and calculate the corresponding results. Second, it is much easier to create and update than a traditional spreadsheet. Finally, it can be used to quickly generate charts and graphs to visualize the data.
Are There Any Limitations to Using a One Variable Data Table in Excel?
Yes, there are some limitations to using a one variable data table in Excel. First, the data table can only display the results of a single formula. Second, the data table is limited to two columns of data. Finally, the data table does not allow for complex calculations or formulas.
What are Some Tips for Creating a One Variable Data Table in Excel?
There are several tips for creating a one variable data table in Excel. First, make sure that the formula you use to calculate the result is correct. Second, double-check the data you enter into the table to ensure that it is accurate. Third, make sure that the input values and the results of the calculation are properly aligned in the table. Finally, use the Data Table feature to quickly and easily create the one variable data table.
Create a one-variable data table in Excel 2010
Creating a one variable data table in Excel can be a useful way to quickly analyze data. With a few simple steps, you can easily create a one variable data table and get the insights you need from your data. Whether you are looking to compare data or analyze a trend, a one variable data table can be a great way to visualize your data and make informed decisions.