


How to Do Mode in Excel?

Excel is a powerful tool for data analysis and data visualization, and one of its most powerful features is the ability to calculate the mode of a dataset. Whether you are a student or an experienced professional, understanding how to do mode in Excel can help you make sense of your data and make more informed decisions. In this article, we’ll explain exactly how to do mode in Excel and show you how to use this powerful feature to your advantage.
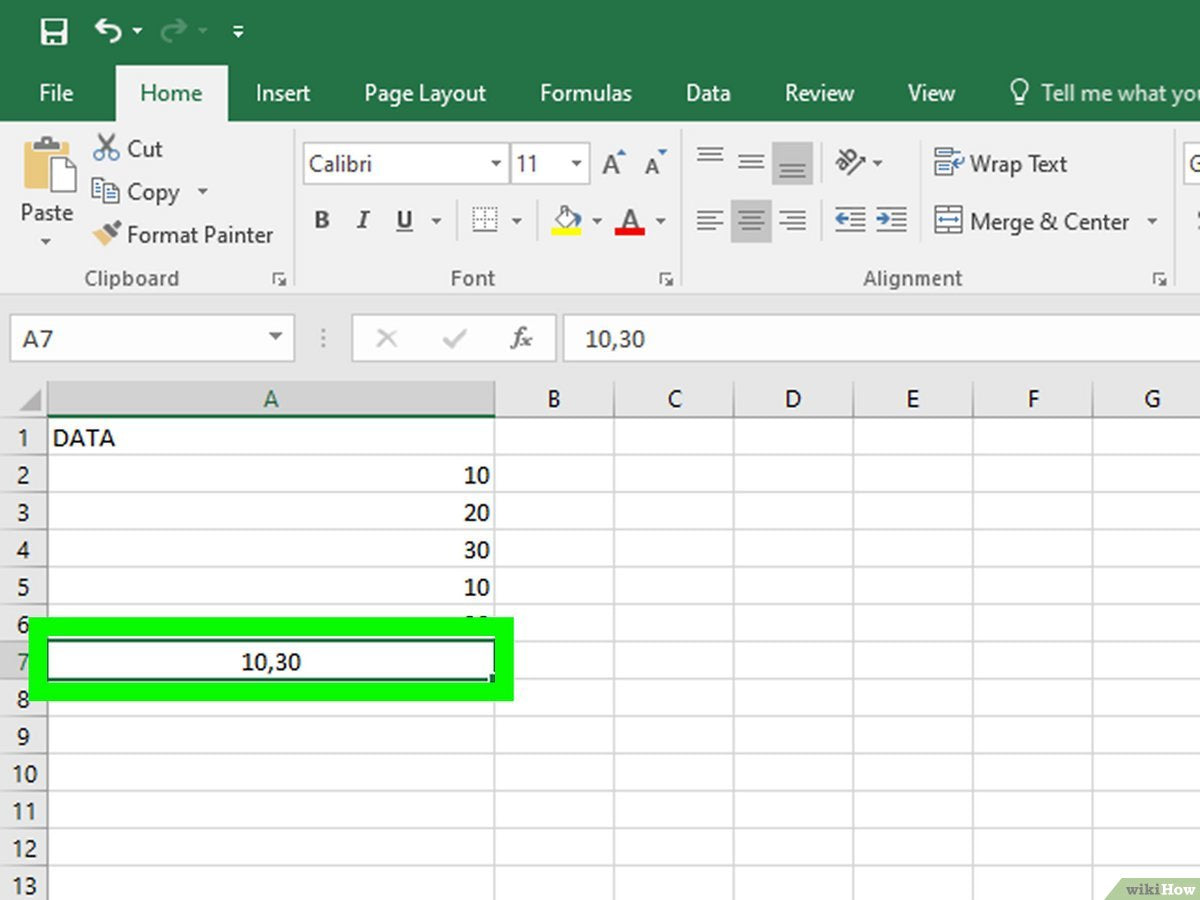
- Select the cells that contain the numbers for which you want to calculate the Mode.
- Click the “Formulas” tab.
- Click the “More Functions” button.
- Select “Statistical” from the list.
- Click “MODE.SNGL”.
- Click the range selector button.
- Select the range of cells to analyze.
- Click “OK”.
- Click “OK” again to obtain the Mode.
What is Mode in Excel?
Mode is a statistical term that refers to the most frequently appearing number in a given set of data. It is the value that appears most often in a data set. When it comes to performing statistical analysis, the mode is the most useful statistic when dealing with categorical data. Excel provides an easy way to calculate the mode of data.
Mode is an important tool for understanding data and identifying potential trends. Excel can help you quickly calculate the mode of data so that you can quickly identify patterns and make decisions accordingly.
How to Calculate Mode in Excel?
The mode can be calculated in Excel using the MODE function. This function requires you to provide the range of numbers in which you want to calculate the mode. The syntax for the MODE function is:
MODE(range)
Where range is the range of numbers you want to calculate the mode for. For example, if you have the following data in cells A1 to A5:
1, 3, 3, 4, 5
You would use the following formula to calculate the mode of this data:
=MODE(A1:A5)
The result of this formula would be 3, which is the most frequent number in the data set.
Using Mode with Other Functions
The MODE function can also be used with other functions to calculate more complex statistics. For example, the AVERAGE and MODE functions can be used together to calculate the mean and mode of a data set. To do this, you would use the following formula:
AVERAGE(range1, MODE(range2))
Where range1 and range2 are the ranges of data you wish to calculate the mean and mode of. For example, if you have the following data in cells A1 to A5:
1, 3, 3, 4, 5
You would use the following formula to calculate the mean and mode of the data:
=AVERAGE(A1:A5,MODE(A1:A5))
The result of this formula would be 3.5, which is the mean of the data set, and 3, which is the mode of the data set.
Using Mode for Categorical Data
The MODE function can also be used to calculate the mode for categorical data. This is useful for understanding the most common category in a data set. To do this, you would use the following formula:
MODE.MULT(range)
Where range is the range of categorical data you wish to calculate the mode for. For example, if you have the following data in cells A1 to A5:
cat, dog, dog, bird, fish
You would use the following formula to calculate the mode of the data:
=MODE.MULT(A1:A5)
The result of this formula would be dog, which is the most frequent category in the data set.
Using Mode with Conditional Formatting
The MODE function can also be used with conditional formatting to highlight the most frequent values in a data set. To do this, you would use the following formula:
MODE.EQ(range,value)
Where range is the range of data you wish to format and value is the value to highlight. For example, if you have the following data in cells A1 to A5:
1, 3, 3, 4, 5
You would use the following formula to highlight the most frequent value in the data set:
=MODE.EQ(A1:A5,A1)
The result of this formula would be 3, which is the most frequent value in the data set. The cells containing this value would be highlighted according to the conditional formatting rules you have set.
Few Frequently Asked Questions
What is Mode in Excel?
Mode in Excel is a statistical measure that is used to measure the frequency of occurrence of a particular value within a given dataset. It is one of the descriptive statistics that can help us to understand the characteristics of the data better. Mode is the value that has the highest number of occurrences in a given dataset. For example, if a dataset consists of the numbers 1, 2, 3, 4, 5, 6, and 8, then the mode of the dataset is 3, since it has the highest frequency of occurrence.
What are the Steps to Calculate Mode in Excel?
Step 1: Organise the data in a column.
Step 2: Select the column with the data and click the “Data” tab.
Step 3: Click “Data Analysis” and select “Descriptive Statistics”.
Step 4: Select the column with the data and click “OK”.
Step 5: In the “Output Range” box, select the cell where you want the results to appear.
Step 6: In the “Summary Statistics” box, check the box for “Mode” and click “OK”.
How to Find Mode for Grouped Data in Excel?
To find the mode for grouped data in Excel, we first need to calculate the frequency of each value in the dataset. Then, we need to find the value with the highest frequency. The value with the highest frequency is the mode of the dataset. To calculate the frequency of each value, we can use the COUNTIF function. For example, if we have the following dataset: 1, 2, 3, 4, 5, 6, 8, the COUNTIF function would return the following results: 1 (1), 2 (2), 3 (2), 4 (1), 5 (1), 6 (1), 8 (1). The mode of the dataset is 3, since it has the highest frequency of occurrence.
How to Find Mode for Continuous Data in Excel?
Finding the mode for continuous data in Excel requires the use of a formula. The formula for mode for continuous data is: Mode = mean + (median – mean) / 2. To calculate the mode for continuous data using this formula, we first need to calculate the mean and median of the dataset. Then, we can use the formula to calculate the mode. For example, if the mean of a dataset is 5 and the median is 7, then the mode of the dataset is 6 (5 + (7 – 5) / 2).
What is the Difference Between Mode and Mean?
The mode and the mean are two different statistical measures that are used to measure the characteristics of a dataset. The mode is the value that has the highest number of occurrences in a given dataset, while the mean is the average of the values in a dataset. Thus, the mode is the most frequently occurring value in a dataset, while the mean is the average of all the values in a dataset.
What is the Difference Between Mode and Median?
The mode and the median are two different statistical measures that are used to measure the characteristics of a dataset. The mode is the value that has the highest number of occurrences in a given dataset, while the median is the middle value of a dataset when the values are arranged in ascending or descending order. Thus, the mode is the most frequently occurring value in a dataset, while the median is the middle value of a dataset when the values are sorted.
The Mode function in Excel is a great way to quickly find the most frequently occurring value in a dataset. Whether you’re a novice or a professional, you can use the Mode function to quickly and accurately determine the most common values in a set of data. With a few simple clicks, you can create reports that compare and contrast different groups of data and make more informed decisions. Now that you know how to use the Mode function in Excel, you can start making more accurate and meaningful decisions with your data.