


How to Do Percentiles in Excel?

In the world of data analysis, understanding how to do percentiles in Excel is an important skill to have. Percentiles are a key measure of how data is distributed across a population and can be used to identify trends and make comparisons. Knowing how to calculate percentiles in Excel can be a valuable tool to help you make better decisions and be more efficient in your work. In this article, we’ll provide a step-by-step guide on how to do percentiles in Excel, including the formulas and functions you’ll need to use. Read on to learn more about how to make the most of this powerful data analysis tool.
To calculate percentiles in Excel, use the PERCENTILE.INC or PERCENTILE.EXC functions. With the PERCENTILE.INC function, the percentile is calculated inclusively, which means the value at the given percentile is included in the calculation. With the PERCENTILE.EXC function, the percentile is calculated exclusively, which means the value at the given percentile is not included in the calculation.
Step-by-step tutorial:
- Open the spreadsheet in Excel
- Type the following formula into the cell: =PERCENTILE.INC(array,k)
- Replace “array” with the array of the data from which you want to calculate the percentile
- Replace “k” with the percentile which you want to calculate
- Press Enter to calculate the percentile
Understanding the Concept of Percentiles in Excel
The concept of percentiles is important to understand in order to be able to effectively analyze and interpret data in Excel. Percentiles are used to measure the relative standing of values within a set of data, and are calculated by dividing the number of values in a set into 100 equal parts. For example, if a set contains 100 values, then the 20th percentile would be the value that lies at the 20th position in the set, and so on. Percentiles can be used to compare values within a set, or to compare different sets of data.
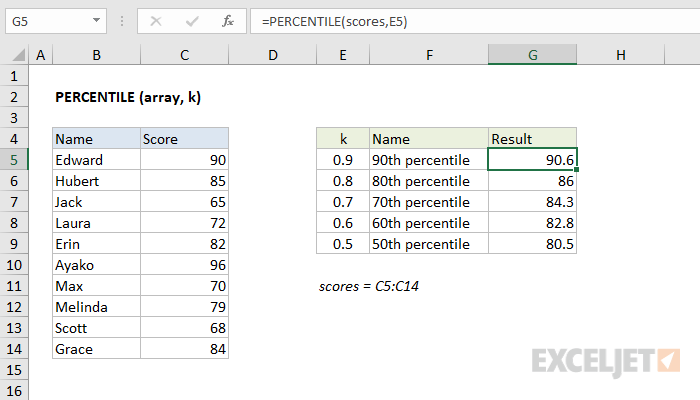
In Excel, percentiles are calculated using the PERCENTILE function. The PERCENTILE function takes two arguments: the array of values to be analyzed, and the percentile to be calculated. The function returns the value that lies at the specified percentile within the array of values. For example, if the array contains 10 values, and the percentile to be calculated is the 75th percentile, the PERCENTILE function will return the value that lies at the 75th position in the set.
Percentiles can be used to compare different sets of data, as well as to identify outliers or values that lie outside of the normal range for a given set of data. For example, if a set of values contains 10 values, and the 75th percentile is calculated, any value that lies above the 75th percentile can be considered an outlier.
Using the PERCENTILE Function in Excel
The PERCENTILE function is used to calculate percentiles in Excel. To use the function, select the cell where the percentile value should be displayed, and enter the PERCENTILE function. The function takes two arguments: the array of values to be analyzed, and the percentile to be calculated. The array of values must be entered as a range of cells, and the percentile must be entered as a decimal number.
For example, if the set of values is in the range A1:A10, and the 75th percentile is to be calculated, the PERCENTILE function should be entered as follows: =PERCENTILE(A1:A10,0.75). This will return the value that lies at the 75th percentile in the set of values.
Calculating Percentiles for Different Sets of Data
The PERCENTILE function can also be used to calculate percentiles for different sets of data. For example, if two sets of data are to be compared, the PERCENTILE function can be used to calculate the percentile of each set relative to the other. To do this, the PERCENTILE function should be entered with two arrays of values as arguments. The function will then return the percentile of each set relative to the other.
For example, if the two sets are in the ranges A1:A10 and B1:B10, and the 75th percentile of each set is to be calculated, the PERCENTILE function should be entered as follows: =PERCENTILE(A1:A10,B1:B10,0.75). This will return two values: the 75th percentile of the first set relative to the second set, and the 75th percentile of the second set relative to the first set.
Using PERCENTILE.INC and PERCENTILE.EXC in Excel
In addition to the PERCENTILE function, Excel also provides two additional functions for calculating percentiles: PERCENTILE.INC and PERCENTILE.EXC. These two functions are similar to the PERCENTILE function, but they calculate percentiles differently.
The PERCENTILE.INC Function
The PERCENTILE.INC function is used to calculate percentiles using the inclusive method. This means that the value that lies at the specified percentile is included in the calculation. For example, if the 75th percentile is calculated using the PERCENTILE.INC function, the value that lies at the 75th position in the set will be included in the calculation.
The PERCENTILE.EXC Function
The PERCENTILE.EXC function is used to calculate percentiles using the exclusive method. This means that the value that lies at the specified percentile is excluded from the calculation. For example, if the 75th percentile is calculated using the PERCENTILE.EXC function, the value that lies at the 75th position in the set will be excluded from the calculation.
Conclusion
The PERCENTILE, PERCENTILE.INC, and PERCENTILE.EXC functions are all useful tools for calculating percentiles in Excel. They provide an easy and accurate way to analyze and interpret data, and can be used to compare different sets of data. Understanding how to use these functions in Excel is essential for those who wish to effectively analyze and interpret data.
Frequently Asked Questions
What is a Percentile?
A percentile is a measure of position relative to other values in a data set. It is often expressed as a percentage and indicates what percentage of data points fall below or above a particular value. For example, if the 80th percentile of a data set is 8, this means that 80% of the data points in the set are less than or equal to 8.
What is the Formula for Calculating Percentiles?
The formula for calculating a percentile is: p = (N+1)p/100 where p is the percentile and N is the number of data points in the set. For example, if there are 10 data points, the formula to calculate the 75th percentile would be p = (10+1)75/100 = 8.75.
How to Do Percentiles in Excel?
There are several ways to calculate percentiles in Excel. One way is to use the PERCENTILE.INC or PERCENTILE.EXC functions. To use these functions, you need to enter the cell range of the data set into the function, then specify the desired percentile. For example, to calculate the 75th percentile of a set of 10 data points, the formula would be: =PERCENTILE.INC(A1:A10,75).
What is the Difference Between PERCENTILE.INC and PERCENTILE.EXC?
The difference between the PERCENTILE.INC and PERCENTILE.EXC functions is that PERCENTILE.INC calculates the percentile based on the inclusive method, meaning it includes all the data points in the set, while PERCENTILE.EXC calculates the percentile based on the exclusive method, meaning it excludes some of the data points in the set.
How to Calculate Percentiles in Excel Without Using Formulas?
You can also calculate percentiles in Excel without using formulas by using the Rank & Percentile tool. To use this tool, select the data set, go to the Data tab, then select the Rank & Percentile tool. The tool will then generate a percentile table, which can be used to quickly find the desired percentile.
What is the Quartile in Excel?
A quartile is a type of percentile that divides a data set into four equal parts. Quartiles are often used in statistics to analyze the distribution of values in a data set. In Excel, quartiles can be calculated using the QUARTILE.INC or QUARTILE.EXC functions. These functions work in the same way as the PERCENTILE.INC and PERCENTILE.EXC functions, but they divide the data set into four parts instead of one.
By following the steps outlined in this article, you should now have a better understanding of how to do percentiles in Excel. With a few simple clicks, you can quickly and easily calculate percentile rankings in Excel, helping you to better analyze and evaluate data sets. With its vast array of features and easy-to-use interface, Excel is an essential tool for any data analysis project.