


How to Do Variance in Excel?

If you’re looking to learn how to use Microsoft Excel to calculate variance, you’ve come to the right place. In this guide, we’ll walk you through the steps of how to do variance in Excel, the most popular spreadsheet software used by businesses and professionals worldwide. We’ll also explain why variance is important and provide tips to help you maximize your results. By the end of this guide, you’ll have a complete understanding of how to use Excel to calculate variance and be ready to take your data analysis skills to the next level.
Introduction to Variance in Excel
Variance in Excel is a powerful tool used to measure how far actual results vary from a set of expected results. It can be used to identify problems in process, identify areas for improvement, or predict future performance. Variance in Excel is calculated by subtracting the expected results from the actual results. This article provides a step-by-step guide to doing variance in Excel.
Setting up the Variance Calculation
The first step in doing variance in Excel is to set up the calculation. This includes setting up the expected results, the actual results, and the formula to calculate the variance. To set up the expected results, enter the expected value in each cell of the column labeled “Expected”. To set up the actual results, enter the actual value in each cell of the column labeled “Actual”. Finally, to calculate the variance, enter the formula “=Actual-Expected” in the cell labeled “Variance”. This formula will subtract the expected value from the actual value and display the variance in the cell.
Formatting the Variance Cells
Once the formula to calculate the variance has been entered, it is important to format the cells properly. To do this, highlight the cells containing the variance and select the “Number” tab. Then, select the “Number” format and set the number of decimal places to two. This will ensure that the variance is displayed accurately.
Analyzing the Variance Results
Once the variance has been calculated, it is important to analyze the results. The results can be used to identify areas for improvement, predict future performance, or identify problems in the process. To analyze the variance results, look for patterns or trends in the data. For example, if the variance is consistently negative, it may indicate that there is a problem with the process.
Visualizing the Variance Results
Visualizing the variance results can help make it easier to identify patterns and trends in the data. To do this, create a chart using the variance data. In Excel, select the data, then click the “Insert” tab and select “Chart”. This will open a dialog box where you can select the type of chart you want to create. Select the type of chart that best suits your needs, then click “OK”. This will create a chart with the variance data.
Interpreting the Variance Chart
Once the chart has been created, it is important to interpret the results. Look for patterns in the data, such as an overall trend in the variance or specific points where the variance changes dramatically. This can help identify areas for improvement or potential problems in the process.
Saving the Variance Chart
Once the chart has been created and interpreted, it is important to save it. To do this, select the chart, then click the “File” tab and select “Save As”. This will open a dialog box where you can select the location and name of the file. Select the location and name of the file, then click “Save”. This will save the chart and make it available for future reference.
Frequently Asked Questions
What is Variance in Excel?
Variance in Excel is a statistical measure that helps to show how much a set of numbers are spread out. It evaluates the deviation of each value from the mean of the set. It is a useful tool for analyzing data sets and comparing data across different sets. Variance can be calculated in Excel by subtracting the mean of a data set from each value, and then squaring the result. The resulting numbers are then added together and divided by the number of values in the data set. This will give you the variance of the data set.
What Information do I Need for Variance in Excel?
In order to calculate variance in Excel, you will need the data set that you want to analyze. This could be a list of numbers, or a set of data points from a graph or chart. You will also need to know the mean of the data set, which can be calculated by adding all of the numbers together and dividing by the number of values in the set.
How do I Calculate Variance in Excel?
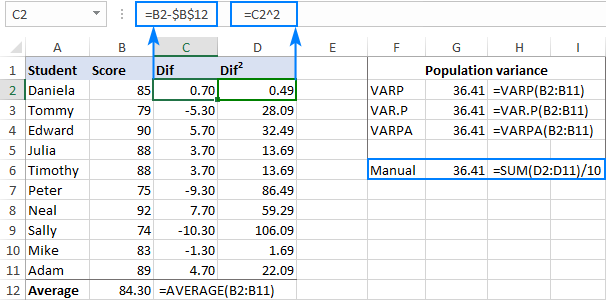
In order to calculate the variance in Excel, you will need to subtract the mean of the data set from each value in the data set. This can be done by using the formula “=A1-Mean”, where A1 is the cell containing the value you want to subtract from. Once this is done, you will need to square the result of each subtraction by using the formula “=A1^2”. You will then need to sum all of the squared results by using the formula “=SUM(A1:A2)”, where A1 and A2 are the cells containing the squared results. Finally, the variance can be calculated by dividing the sum of the squared results by the number of values in the data set.
What are the Benefits of Using Variance in Excel?
There are many benefits to using variance in Excel. It can be used to compare data sets and identify trends. It can also be used to determine the spread of a particular data set, which can be useful in making decisions about investments or other financial decisions. It is also a useful tool for analyzing the results of experiments and seeing how much variability there is in the results.
What are Some Limitations of Calculating Variance in Excel?
One of the main limitations of calculating variance in Excel is that it is limited to a single data set. It cannot be used to compare multiple data sets, and it does not take into account other factors that may affect the variance of a data set, such as outliers. Additionally, Excel is not able to take into account the effect of weights or other factors that may influence the data set.
What are Some Alternatives to Calculating Variance in Excel?
For those who need to compare multiple data sets or take into account factors such as weights, there are several alternative methods for calculating variance. These include using statistical software packages such as SPSS or R, or using online tools such as Wolfram Alpha. These alternatives may offer more advanced features and may be more suitable for more complex analyses.
In conclusion, variance in Excel is a great way to quickly and accurately analyze data. It allows you to identify trends and outliers, as well as quickly identify potential issues. With a little practice, you can become an expert in using Excel to do variance analysis and get the most out of your data.