


How to Find Minimum and Maximum in Excel?

Are you looking for an easy way to quickly find the minimum and maximum of a set of data in Excel? Look no further. In this article, we will walk you through the steps to quickly and easily find the minimum and maximum of your data in Excel. We will provide you with step-by-step instructions as well as helpful tips and tricks to make this process as seamless as possible. Whether you are a beginner or an expert, this article will help you find your minimum and maximum values with ease. So let’s get started!
Finding the Minimum and Maximum in Excel is easy. To do so, first select the data column, then click on the “Data” tab and select the “Sort” option. From the Sort window, you can choose either to sort in Ascending or Descending order. After selecting your desired order, click on the “OK” button to sort the data. To find the minimum and maximum, simply look for the first and last values in the sorted data column.
Alternatively, you can use the MIN and MAX functions in Excel to find the minimum and maximum values in a data column. The MIN and MAX functions can be found in the “Formulas” tab. To use the functions, select the data column and click on the “Formula” tab. Then, simply enter either the MIN or MAX function to find the desired result.
Finding Minimum and Maximum Values in Excel
Finding the minimum and maximum values in Excel is a useful tool for data analysis. It can help you identify trends or outliers in your data and can be used in a variety of ways. In this tutorial, we’ll show you how to find the minimum and maximum values in Excel and how to use them to analyze your data.
The first step is to decide which data set you want to analyze. You can use the minimum and maximum values to analyze a single column of data, or you can use them to analyze multiple columns of data. Once you have decided which data set you want to analyze, you can use the MIN and MAX functions in Excel to find the minimum and maximum values. The MIN and MAX functions can be used with a single column of data, or they can be used with multiple columns of data.
Using the MIN and MAX Functions with Single Columns of Data
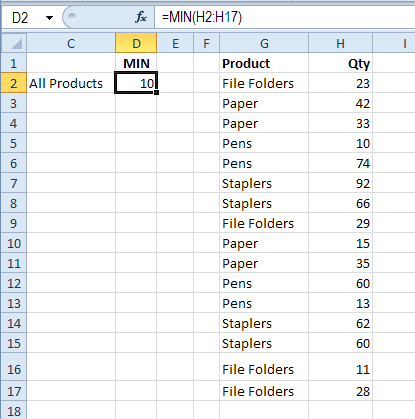
If you want to find the minimum and maximum values in a single column of data, you can use the MIN and MAX functions. To use the MIN and MAX functions, select the cell that contains the data you want to analyze, then type the following formula into the formula bar: =MIN(A1:A10). This formula will find the minimum value in the range A1 through A10. To find the maximum value, you can use the MAX function: =MAX(A1:A10).
Using the MIN and MAX Functions with Multiple Columns of Data
If you want to find the minimum and maximum values in multiple columns of data, you can use the MIN and MAX functions in combination. For example, if you have data in columns A, B, and C, you can use the following formula to find the minimum value: =MIN(A1:C10). This formula will find the minimum value in the range A1 through C10. To find the maximum value, you can use the MAX function: =MAX(A1:C10).
Using the MIN and MAX Functions with Conditional Formatting
You can also use the MIN and MAX functions in combination with conditional formatting to highlight the minimum and maximum values in your data. To do this, select the data you want to analyze, then click the “Conditional Formatting” button in the “Home” tab. From the drop-down menu, select “New Rule” and then select “Use a formula to determine which cells to format”. In the formula field, type the following formula: =A1=MIN(A1:A10). This formula will highlight the minimum value in the range A1 through A10. To highlight the maximum value, you can use the MAX function: =A1=MAX(A1:A10).
Using the MIN and MAX Functions with Pivot Tables
You can also use the MIN and MAX functions with pivot tables to find the minimum and maximum values in your data. To do this, select the data you want to analyze, then click the “Pivot Table” button in the “Insert” tab. In the “Pivot Table” window, select the “Values” field and then select the “Minimum” or “Maximum” function. This will calculate the minimum or maximum value in the selected data range.
Using the MIN and MAX Functions with Other Functions
The MIN and MAX functions can also be used in combination with other functions, such as AVERAGE, MEDIAN, and COUNT, to analyze your data. For example, you can use the following formula to find the average of the minimum and maximum values in a data set: =AVERAGE(MIN(A1:A10), MAX(A1:A10)). This formula will calculate the average of the minimum and maximum values in the range A1 through A10.
Using the MIN and MAX Functions with Charts
Finally, you can also use the MIN and MAX functions in combination with charts to analyze your data. To do this, select the data you want to analyze, then click the “Charts” button in the “Insert” tab. In the “Charts” window, select the chart type and then select the “Minimum” or “Maximum” function. This will calculate the minimum or maximum value in the selected data range and display it in the chart.
Few Frequently Asked Questions
Finding the minimum and maximum values in Excel can be a useful tool for data analysis. With just a few clicks you can find the highest or lowest value, or the range between the two. The process is simple and straightforward, and you can use it to quickly identify outliers or assess the range in your data. Whether you’re a beginner just getting started in Excel or a seasoned pro, this process can help you better understand and analyze your data.