


How to Get Standard Deviation on Excel?

Do you need to calculate the standard deviation on Excel? It doesn’t have to be a daunting task. With the right know-how, you can easily calculate the standard deviation of a data set. In this article, we’ll take a look at how to get the standard deviation on Excel and provide some tips to make the process easier.
- Start by opening Microsoft Excel.
- Go to the “Formulas” tab.
- Under the “Statistical” section, find the function for standard deviation (STDEV.P).
- Enter the numbers that you want to use for the calculation in the parentheses of the function.
- Click the “Enter” button to get the standard deviation.
What is Standard Deviation in Excel?
Standard deviation is a measure of how much the data in a set of values varies from the mean. It is a statistical measure of the spread of the data and is calculated by taking the average difference between each data point and the mean of the data set. It is an important tool for understanding the range of data and how it is distributed in a given data set.
Standard deviation is a commonly used tool to measure the volatility or risk of a given portfolio or investment. It is also used to compare the performance of different investments or portfolios. It can also be used to detect outliers or unusual data points in a data set.
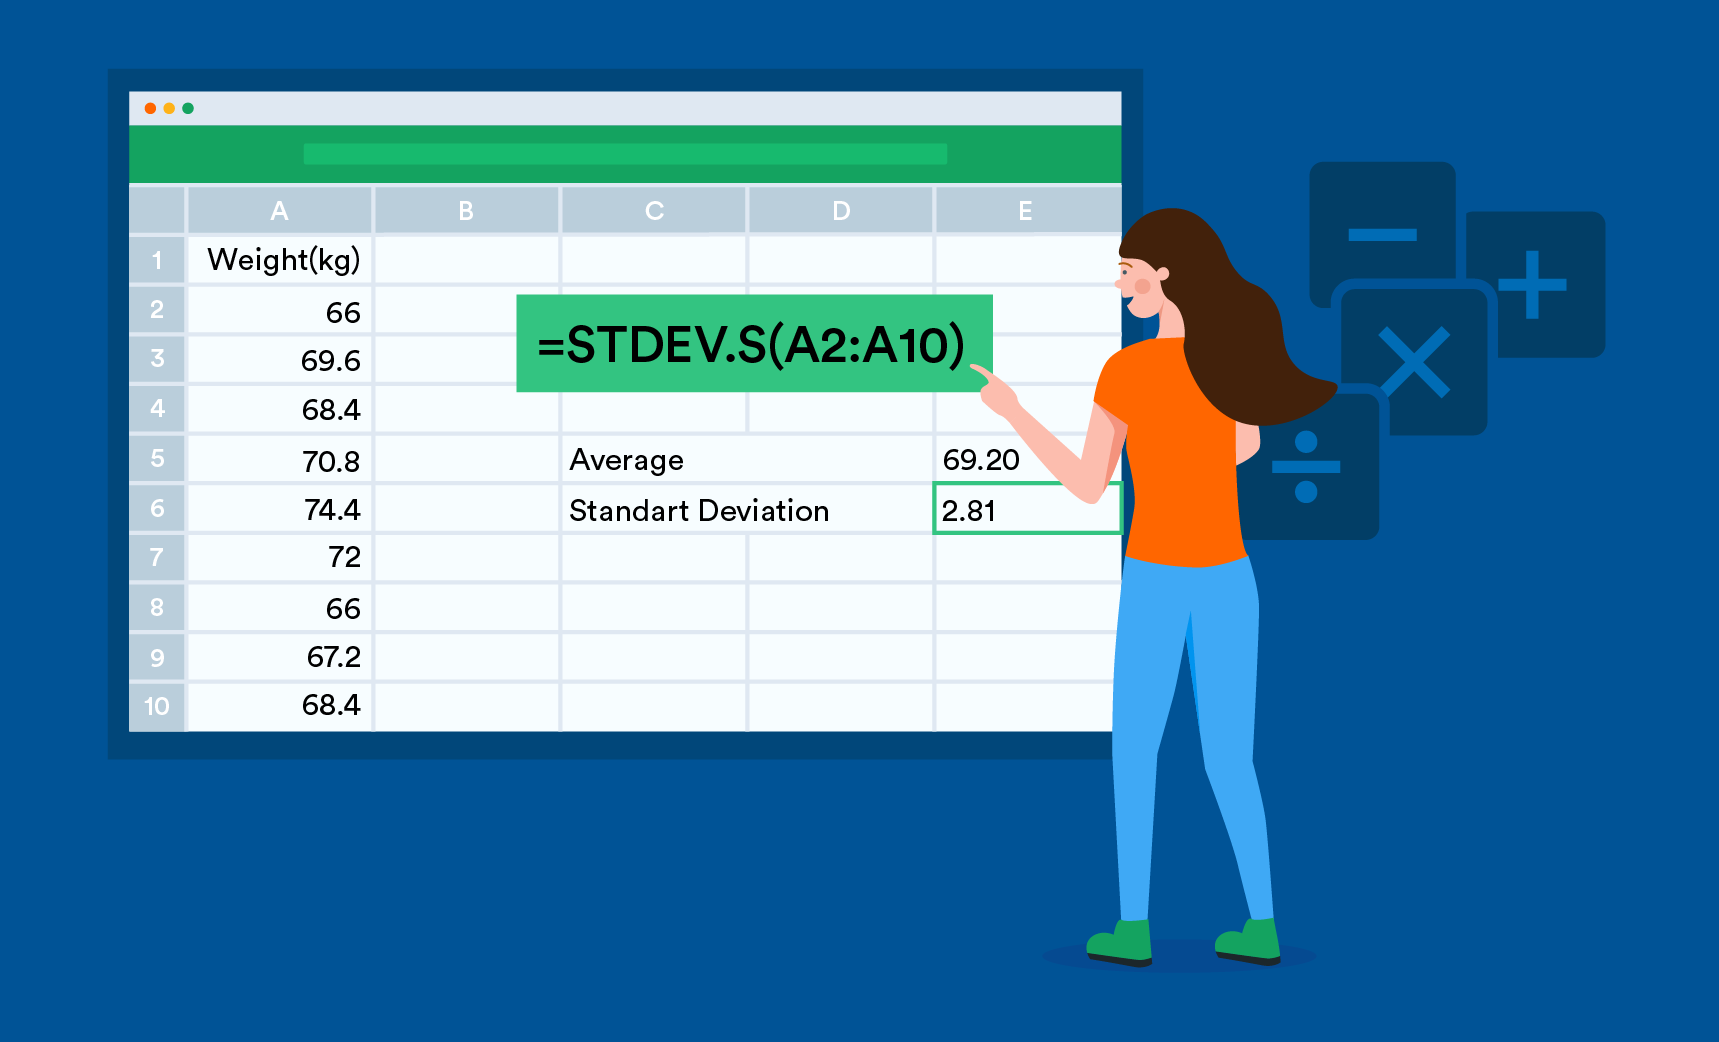
Standard deviation is calculated in Excel using the STDEV.S formula, which stands for sample standard deviation. This formula calculates the standard deviation of a sample data set, which is a subset of a larger data set.
How to Calculate Standard Deviation in Excel?
Calculating standard deviation in Excel is a relatively simple process. To calculate the standard deviation of a set of data, the STDEV.S formula is used. This formula requires that the data is inputted into a range of cells. The formula should be entered into a cell and the range of cells containing the data should be entered as the argument.
The STDEV.S formula will then calculate the standard deviation of the data in the range of cells. The result can be formatted to display the result as a whole number or a decimal. The formula can also be used to calculate the standard deviation of a population, which can be done by entering STDEV.P instead of STDEV.S.
Steps to Calculate Standard Deviation in Excel
The following steps should be followed to calculate the standard deviation in Excel:
Step 1: Enter the Data
The first step is to enter the data into a range of cells. The data should be entered in separate cells and should not be combined into one cell or merged.
Step 2: Enter the Formula
Once the data has been entered, the STDEV.S formula should be entered into an empty cell. The range of cells containing the data should then be entered as the argument into the formula.
Step 3: Format the Result
The result of the formula can then be formatted to display the result as a whole number or a decimal. This can be done by right-clicking on the cell containing the result and selecting “Format Cells”.
How to Interpret Standard Deviation Results in Excel?
Once the standard deviation has been calculated in Excel, it is important to understand how to interpret the results. The standard deviation measures the spread of the data and is typically expressed as a number. The higher the number, the greater the spread of the data.
A low standard deviation indicates that the data points tend to be close to the mean. This means that the data is relatively consistent and does not vary much from the mean. A high standard deviation indicates that the data points are dispersed over a wider range and are more likely to vary from the mean.
Meaning of Standard Deviation Results
The standard deviation can be used to measure the volatility of a given portfolio or investment. A low standard deviation indicates that the portfolio or investment is relatively stable and unlikely to experience large fluctuations in value. A high standard deviation indicates that the portfolio or investment is more volatile and may experience large fluctuations in value.
Applications of Standard Deviation
Standard deviation can also be used to compare the performance of different investments or portfolios. It can be used to detect outliers or unusual data points in a data set. It can also be used to measure the accuracy of a forecasting model.
Frequently Asked Questions
What is Standard Deviation?
Standard deviation is a measure of how spread out numbers are. It measures the average distance of data points from the mean. It is calculated by taking the square root of the variance, which is the sum of the squared differences from the mean divided by the number of data points. The larger the standard deviation, the more spread out the data points are from the mean.
What is the Formula for Standard Deviation in Excel?
The formula for calculating standard deviation in Excel is STDEV.P or STDEV.S. STDEV.P is used for population standard deviation, which calculates the standard deviation for a population of data points. STDEV.S is used for sample standard deviation, which calculates the standard deviation for a sample of data points. Both formulas take in a range of data points as an argument.
How Do I Enter the Formula for Standard Deviation in Excel?
In order to enter the formula for standard deviation in Excel, you must open the formula bar and enter either STDEV.P or STDEV.S. Then, you must enter the range of cells containing the data points as the argument. For example, if the data points are in cells A1-A10, the formula should be written as =STDEV.P(A1:A10).
What Does the Result of the Formula Mean?
The result of the formula is the standard deviation of the data points. It is a measure of how spread out the data points are from the mean. A lower standard deviation indicates that the data points are closer to the mean, while a higher standard deviation indicates that the data points are more spread out from the mean.
Are There Any Other Formulas for Calculating Standard Deviation in Excel?
Yes, there are other formulas for calculating standard deviation in Excel. The VAR.S and VAR.P formulas can be used to calculate the variance, which is the sum of the squared differences from the mean divided by the number of data points. This can then be used to calculate the standard deviation using the SQRT formula.
Are There Any Other Functions for Standard Deviation in Excel?
Yes, there are other functions for standard deviation in Excel. The AVERAGE and STDEV functions can be used to quickly calculate the mean and standard deviation of a range of data points. Additionally, the LINEST function can be used to calculate the standard errors of regression coefficients.
When you are working with data, it is important to understand the standard deviation of your data. Excel makes it easy to calculate the standard deviation of a set of data. With just a few simple steps and a bit of understanding, you can quickly calculate the standard deviation of your data in Excel. This will help you to analyze the data and make informed decisions accordingly.