


How to Show Percentage Increase in Excel?

If you’re an Excel user, you know how powerful the software can be when it comes to analyzing data. Whether you’re doing basic calculations or complex data analysis, Excel is a great way to get the job done. One of the most useful functions in Excel is the ability to show a percentage increase in values. This can be incredibly helpful when you’re looking at trends in your data or comparing different datasets. In this article, we’ll discuss how to show a percentage increase in Excel and the different methods you can use.
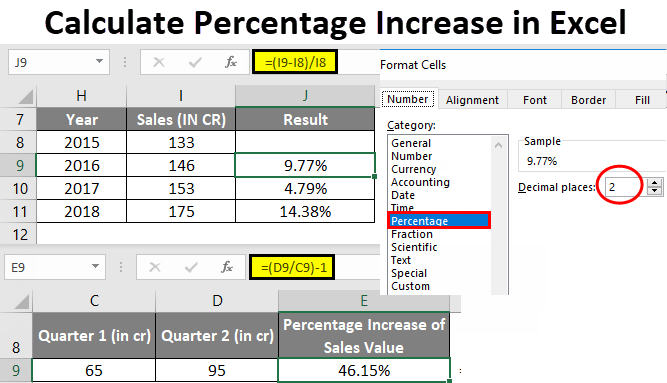
To show a percentage increase in Excel, follow these steps:
- Open Microsoft Excel.
- Enter the original number in the first cell of the worksheet.
- Enter the increased number in the second cell.
- Subtract the original number from the increased number.
- Divide the result by the original number.
- Multiply the result by 100.
- Format the result as a percentage.
Calculate Percentage Increase in Excel
Calculating percentage increase in Excel is a common task for all data analysts. Excel provides a few different ways to show percentage increase, all of which are easy to use. Most often, you will use the formula to calculate the percentage increase or decrease from one period to another. However, there are also several other ways to show the percentage increase in Excel, such as using conditional formatting, PivotTables, and charts.
Using Formulas to Calculate Percentage Increase
The most straightforward way to calculate the percentage increase in Excel is to use a formula. To do this, you need to know the original value and the new value, and then you can use a simple formula to calculate the percentage increase. The formula is simple: divide the new value by the original value and multiply by 100 to show the percentage increase. For example, if the original value is 100 and the new value is 125, the formula would be (125/100)*100, which equals 25%.
If you want to calculate the percentage decrease, you can use the same exact formula but subtract the result from 100. For example, if the original value is 100 and the new value is 75, the formula would be (75/100)*100, which equals 25%. To make this calculation easier, you can use the “ABS” function to calculate the absolute value of the difference.
Using Conditional Formatting to Show Percentage Increase
Another way to show the percentage increase in Excel is to use conditional formatting. This is a great way to quickly visualize the changes in values over time. To do this, select the range of cells you want to format, then click on the “Conditional Formatting” button in the “Home” tab. Select “New Rule” and then choose “Format only cells that contain.” Select “Percentage” from the drop-down menu and enter the value you want to format. For example, you can enter “>25” to format any values greater than 25%. Click “OK” to apply the formatting.
Using PivotTables to Show Percentage Increase
PivotTables are another great way to show the percentage increase in Excel. To use a PivotTable, you need to have your data organized in a tabular format. Then, select the range of cells you want to use and click on the “PivotTable” button in the “Insert” tab. Select “New Worksheet” and then click “OK”. Select the field you want to use to show the percentage increase, and then select “Show Values As” and select “% of Grand Total” from the drop-down menu. Click “OK” and the percentage increase will be displayed in the PivotTable.
Using Charts to Show Percentage Increase
The last way to show the percentage increase in Excel is to use a chart. To do this, select the range of cells you want to chart and then click on the “Insert” tab. Select the type of chart you want to use and then select “Data Labels” from the “Chart Elements” menu. Select “More Options” and then select “Percentage” from the drop-down menu. Click “OK” and the percentage increase will be displayed in the chart.
Using Tables to Show Percentage Increase
The last way to show the percentage increase in Excel is to use a table. To do this, select the range of cells you want to use and then click on the “Insert” tab. Select “Table” and then select “Percentage” from the “Number Format” drop-down menu. Click “OK” and the percentage increase will be displayed in the table.
Top 6 Frequently Asked Questions
The ability to calculate percentage increase in Excel is a powerful tool to measure the success of various projects and investments. By applying the formula shown in this article, you can quickly and easily determine the percentage increase between two numbers. With just a few clicks of the mouse, you can be sure that you’re making the right decisions and staying on track to reach your desired goals. So, if you’re looking to measure the success of your business investments and projects, Excel is an invaluable tool to have in your arsenal.