


How to Use Anova in Excel?

If you’re looking to learn how to use Anova in Excel, you’ve come to the right place. Anova is a powerful statistical tool used to analyze the variance between two or more sets of data. With Excel’s easy-to-use interface, you can quickly and easily create Anova tests that can help you identify significant differences between your data sets. In this guide, we’ll cover the basics of Anova and then show you how to use it in Excel. So, let’s get started!
Introduction to ANOVA Excel
ANOVA stands for Analysis of Variance. It is a statistical technique used to test the null hypothesis, which states that all the samples in a given data set have the same mean or average. ANOVA is used to determine if there is a statistically significant difference between the means of two or more groups. It is used in a variety of research settings, such as comparing the performance of different groups of students on a test or determining if there is a significant difference in the price of a product between two or more stores. Excel is a powerful tool that can be used to perform ANOVA calculations.
Setting up the Data in Excel
Before beginning an ANOVA analysis in Excel, the data must be set up in an appropriate format. First, the data should be organized into columns that represent each of the groups being compared. For example, if there are three groups of students being compared on a test, the columns should be labeled “Group A”, “Group B”, and “Group C”. Each row should contain the scores for the students in each group.
Next, the data needs to be organized into a “one-way” or “two-way” format. A one-way ANOVA compares the means of two or more groups, while a two-way ANOVA compares the means of two or more groups and also looks at the interaction between the groups.
Running the ANOVA Analysis in Excel
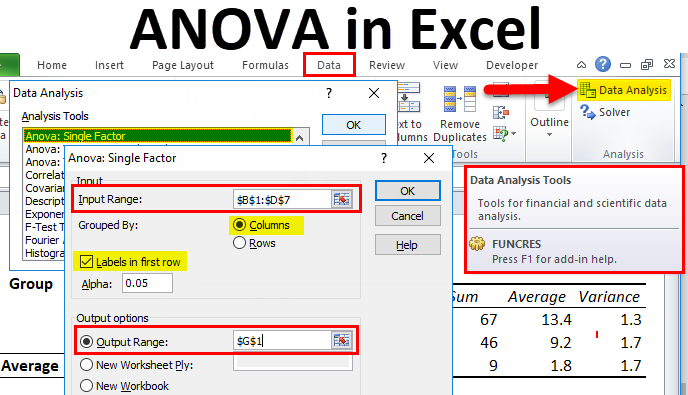
Once the data is organized, the ANOVA analysis can be run in Excel. To do this, select the “Data” tab and then click on the “Data Analysis” button. This will open the “Data Analysis” dialog box. Select “ANOVA: Single Factor” or “ANOVA: Two-Factor With Replication”, depending on the type of analysis you are performing.
In the “Input Range” box, enter the range of cells containing the data. In the “Output Range” box, enter the range of cells where the results of the analysis will be stored. Then, click “OK” to run the ANOVA analysis.
Interpreting the Results of the ANOVA Analysis
Once the ANOVA analysis has been run, the results can be interpreted. The most important result is the F-statistic, which is a measure of the overall difference between the groups. If the F-statistic is significant (greater than the critical value), then there is a statistically significant difference between the means of the groups.
The next important result is the p-value. This is a measure of how likely it is that the difference between the groups is due to chance. If the p-value is less than 0.05, then the difference between the groups is statistically significant.
Conducting Post-Hoc Tests
Once the ANOVA analysis has been run and the results have been interpreted, post-hoc tests can be conducted to determine which groups are significantly different from each other. The most common post-hoc tests are Tukey’s HSD and LSD tests. These tests compare the means of all pairs of groups to determine which ones are significantly different from each other.
Conclusion
ANOVA is a powerful statistical tool that can be used to compare the means of two or more groups. Excel is a versatile tool that can be used to perform ANOVA calculations and interpret the results. Once the ANOVA analysis has been run, post-hoc tests can be conducted to determine which groups are significantly different from each other.
Related FAQ
What is Anova?
Anova stands for Analysis of Variance. It is a statistical technique used to compare multiple means. It is used to compare the means of two or more independent groups in order to determine if there is a statistically significant difference between them. Anova can also be used to test for differences between more than two groups. It is frequently used in the fields of psychology, economics, and education.
What is the Purpose of Anova?
The purpose of Anova is to determine if the means of two or more groups are significantly different from one another. It is used to test the null hypothesis, which states that there is no difference between the means of the groups. Anova uses a F-test to compare the means of the groups, which provides a measure of how much variability there is among the groups.
How to Use Anova in Excel?
Anova can be used in Excel to compare the means of two or more groups. To do this, first enter the data into a spreadsheet. Then, select the Analysis ToolPak from the Data tab. This will open a window with several statistical functions, including Anova. Select the Anova function and enter the range of the data for each group. Excel will then run the Anova test and provide the results as a table.
What Does the Anova Output Mean?
The Anova output consists of a table that contains several columns. The first column contains the F-ratio, which indicates the strength of evidence that the groups are different. The next columns provide the degrees of freedom, the sum of squares, the mean squares, and the F-value. These values can be used to determine the significance of the results.
What is the Significance of the F-Value?
The F-value is the most important value in the Anova output. It indicates the strength of evidence that the means of the groups are different. If the F-value is greater than a certain critical value, then the null hypothesis can be rejected, indicating that the means of the groups are significantly different.
What is the Critical Value?
The critical value is a threshold that is used to determine whether or not the null hypothesis should be rejected. The critical value is determined by the degrees of freedom and the significance level. If the F-value is greater than the critical value, then the null hypothesis can be rejected.
Anova in Excel is a powerful and convenient tool for performing data analysis. It provides a fast and efficient way to compare means between two or more groups. The output provides detailed information about the variations in the data and can be used to make meaningful decisions. With a few simple steps, you can quickly and accurately analyze your data in Excel and make informed decisions. Take the time to understand how to use ANOVA in Excel, and it will be sure to save you time and money in your data analysis.