


How to Use Dax in Power Bi?

Are you a data analyst looking to get the most out of Power BI? If so, you’re in the right place! Power BI is a powerful and versatile business intelligence tool that can help you quickly and easily visualize your data. With the right setup and guidance, you can use the DAX language to unlock the full potential of Power BI. In this article, we’ll discuss how to use DAX in Power BI, including how to create DAX expressions, what types of expressions are available, and how to use DAX to enhance Power BI visuals. By the end, you’ll be a pro at using DAX in Power BI and ready to take your data analysis to the next level!
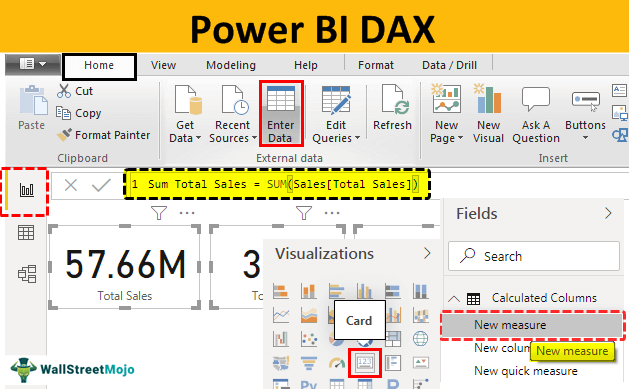
DAX (Data Analysis Expressions) is a powerful language for creating calculated columns and measures in Power BI. Using DAX, you can easily create complex calculations and powerful formulas to analyze your data. Here are the steps on how to use DAX in Power BI:
- Step 1: Open a Power BI report in the Power BI service.
- Step 2: Select the data visualization you want to edit.
- Step 3: Select the field you want to add a measure to.
- Step 4: Select the New Measure button in the Visualizations pane.
- Step 5: Enter the DAX expression in the formula bar.
- Step 6: Click OK to save and apply the measure.
What is DAX?
DAX stands for Data Analysis Expressions, and is a language used to create calculated columns and measures in Power BI. It is similar to Excel formulas, but is much more powerful and efficient in dealing with larger datasets. DAX is used to perform calculations on columns and tables, and is the primary language used in Power BI.
DAX is a powerful language, with a variety of functions that allow users to perform complex calculations and analysis on their data. It can be used to create expressions and measures, which are used in Power BI reports and visualizations.
Advantages of Using DAX
DAX is a powerful language, and provides a number of advantages to users. It is easy to use, and can be quickly learned by anyone who is familiar with Excel formulas. It is also much more efficient than Excel, and can be used to quickly perform complex calculations on large datasets.
Another advantage of using DAX is that it allows users to create measures, which are calculations that can be used in reports and visualizations. This allows users to quickly analyze their data, without having to manually create calculations.
Using DAX in Power BI
Using DAX in Power BI is a simple process. First, users must create a data model, which is a collection of tables and columns that can be used for calculations. Once the data model is created, users can create calculated columns, measures, and expressions using DAX.
Creating a calculated column is done by selecting the “New Column” option in Power BI, and then entering the DAX formula. Measures and expressions are created in a similar way, by selecting the “New Measure” or “New Expression” option, and then entering the DAX formula.
Understanding DAX Syntax
In order to successfully use DAX in Power BI, it is important to understand the syntax. DAX is a powerful language, and has a number of different operators and functions that can be used to create calculations and expressions.
The most basic syntax of DAX consists of two parts, the operator and the value. The operator is the action that is performed on the value, such as addition, subtraction, multiplication, or division. The value is the data that is being used in the calculation, such as a column or a measure.
Using Operators in DAX
DAX supports a variety of operators, which can be used to perform calculations. The most common operators are addition (+), subtraction (-), multiplication (*), and division (/). Other operators include comparison operators (>, >=, Using Functions in DAX
In addition to operators, DAX also supports a variety of functions, which can be used to perform calculations. The most common functions are SUM, AVERAGE, MAX, MIN, and COUNT. Other functions include RANK, RANKX, FILTER, and CALCULATE.
Creating Measures and Expressions in DAX
Measures and expressions are calculations that can be used in Power BI reports and visualizations. Measures are calculations that are based on columns of data, and expressions are calculations that are based on other measures.
To create a measure or expression in DAX, users must select the “New Measure” or “New Expression” option in Power BI, and then enter the DAX formula. The formula must include both an operator and a value, and may include additional functions and operators.
Using DAX Variables
DAX also supports variables, which are values that can be used in calculations. Variables can be used to store values, which can then be used in multiple calculations. To create a variable in DAX, users must use the VAR keyword followed by the name of the variable, and then assign a value to the variable.
Using Time Intelligence in DAX
Time intelligence is a powerful feature of DAX that allows users to perform calculations on time-based data. Time intelligence functions can be used to calculate values over different time periods, such as days, weeks, months, and years. To use time intelligence in DAX, users must use the TIMEYEAR, TIMEMONTH, TIMEDAY, and TIME functions.
Creating Visualizations in Power BI
Once the DAX calculations are created, users can use them in Power BI reports and visualizations. To create a visualization, users must select the “New Visualization” option in Power BI, and then select the type of visualization they would like to create.
Once the visualization is created, users can select the measures or expressions that they would like to use in the visualization. This will allow users to quickly analyze their data, and gain insights into their data.
Frequently Asked Questions
What is DAX in Power BI?
DAX in Power BI is a data analysis expression language that is used to calculate, analyze, and manipulate data in Power BI. It is used in conjunction with the Power BI platform to provide additional functionality to users and to create data visualizations that can be used to make data-driven decisions. DAX stands for Data Analysis eXpression and is a language that is used to query and manipulate data in a Power BI dataset. DAX is similar to other languages like SQL, but is specifically designed to work with the Power BI platform. It enables users to create powerful data models and visualizations that can be used to make informed decisions.
What are the main components of DAX?
The main components of DAX are functions, operators, and expressions. Functions are predefined formulas used to perform calculations and operations on data. Operators are used to alter the results of a function or expression, such as adding, subtracting, multiplying, or dividing. Expressions are used to combine different elements together to create a result. All of the components of DAX are used together to create powerful analyses and visualizations in Power BI.
What are some examples of DAX functions?
Some examples of DAX functions include SUM, AVERAGE, COUNT, MIN, and MAX. SUM is used to add up the values of a column of data, AVERAGE is used to calculate the average of a column of data, COUNT is used to count the number of records in a column, MIN is used to find the minimum value of a column, and MAX is used to find the maximum value of a column. Other functions include DISTINCT, RANK, and VAR. All of these functions can be used to analyze data in Power BI.
How do I use DAX in Power BI?
To use DAX in Power BI, you first need to create a dataset or use an existing dataset. Once you have a dataset, you can use the DAX language to query and manipulate the data. To do this, you can use DAX functions, operators, and expressions. You can also create custom measures and visualizations in Power BI using DAX. Once you have created your DAX queries and visualizations, you can save them and use them in other Power BI reports.
What are the advantages of using DAX in Power BI?
The main advantage of using DAX in Power BI is that it enables users to create powerful data models and visualizations that can be used to make informed decisions. DAX is a powerful language that enables users to query and manipulate data in a powerful and efficient way. It also enables users to create custom measures and visualizations in Power BI that can be used to make data-driven decisions.
What are the disadvantages of using DAX in Power BI?
The main disadvantage of using DAX in Power BI is that it can be difficult to learn and understand. DAX is a powerful language that is designed to be used in conjunction with the Power BI platform, and it can take time to learn and understand the language and how to use it effectively. Additionally, DAX can be difficult to troubleshoot due to its complexity, and it can be time-consuming to debug and optimize DAX queries.
Using DAX in Power BI is an incredibly powerful tool to help you get the most out of your data. It provides a wide range of functions and options to help you manipulate and analyze your data in meaningful ways. From filtering, to grouping, to aggregating, to creating measures and calculations, DAX has something for everyone. By leveraging the power of DAX in Power BI, you’ll be able to make better decisions and gain deeper insights from your data, which can help you drive better results for your business.