


How to Use Frequency in Excel?

If you have ever worked with data in Microsoft Excel, you know how tedious it can be to generate meaningful insights from it. Luckily, Excel has a powerful function called frequency that can help you quickly and easily analyze data by counting how often a certain value appears in a range of cells. In this guide, we’ll show you how to use frequency in Excel to get the insights you need.
Top 6 Frequently Asked Questions
What is Frequency in Excel?
Frequency in Excel is a function which returns the number of occurrences of a specified value within a range of cells. It is helpful in seeing how often a particular value occurs within a data set. It can be used to identify trends in data, or to compare data sets to each other. Frequency can be used to analyze data in a variety of ways, including evaluating distributions, discovering outliers, and calculating probabilities.
What is the Syntax of Frequency in Excel?
The syntax for Frequency in Excel is as follows:
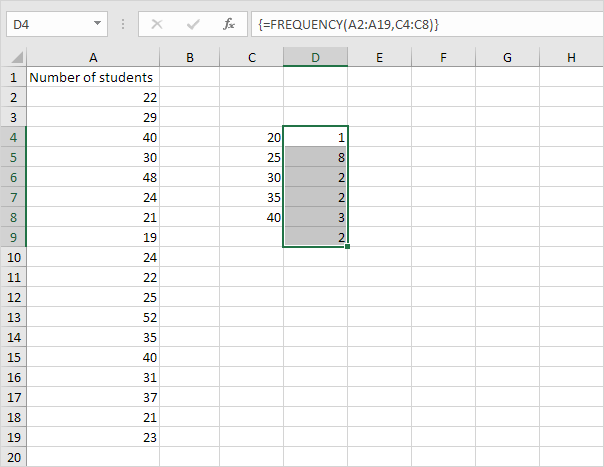
FREQUENCY(data_array, bins_array)
Where “data_array” is the range of cells containing the data to be analyzed and “bins_array” is the range of cells containing the upper and lower limits for each group or bin.
How to Use Frequency in Excel?
Using Frequency in Excel is relatively straightforward. Start by selecting the range of cells containing the data to be analyzed. Next, create an array of bins containing the upper and lower limits for each group or bin. Finally, enter the FREQUENCY function, using the syntax above, into the cell where the output should appear. When the function is entered, the frequency of the data in each bin is returned.
What are the Limitations of Frequency in Excel?
Frequency in Excel is a useful tool for analyzing data, but it has some limitations. First, it is only able to analyze data sets with up to 30 bins. Additionally, the data must be numerical. If the data set contains non-numerical data, then it must be converted to numerical data before it can be used with the Frequency function.
What are the Benefits of Using Frequency in Excel?
Using Frequency in Excel can be beneficial in a variety of ways. It can help identify trends in data, allowing users to quickly identify areas that may require more attention or analysis. It can also be used to compare data sets to each other, allowing users to easily spot differences between the sets. Additionally, Frequency can be used to calculate probabilities, which can be helpful when making decisions.
What are Alternatives to Frequency in Excel?
If Frequency in Excel is not available or does not meet the user’s needs, there are a few alternatives that can be used. One alternative is Pivot Tables, which can be used to quickly analyze data by grouping it into categories. Another option is to use a statistical software package, such as SPSS or R, which can provide more advanced analysis options. Finally, there are a number of online data analysis tools that can be used, such as Databox or Tableau.
In conclusion, using frequency in Excel is a great way to analyze your data and get the most out of it. With the help of Excel’s powerful built-in functions and formulas, you can easily count the frequency of values in a range of cells, calculate the percentage of each value, and even sort the data in order to make the most of your analysis. Whether you are a beginner or an experienced user, this tutorial will help you get the most out of your Excel data.