


How to Use Linest in Excel?

Are you looking to get to grips with Microsoft Excel and master the art of using lines? If so, you have come to the right place. In this article, we will walk you through the basics of how to use lines in Excel, to ensure you can create effective and visually appealing spreadsheets. With easy-to-follow instructions and helpful tips, you will soon be a pro at using lines in Excel. So, let’s get started!
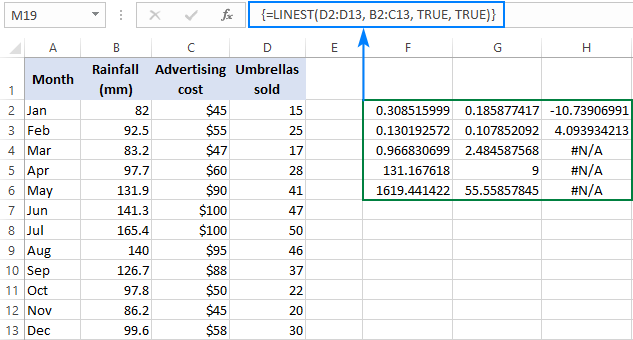
Microsoft Excel’s LINEST function is used to calculate the statistics associated with a straight line, computed by linear regression. To use the function:
- Input the known x and y values into columns of the worksheet.
- Select a blank cell for the results of the function.
- Enter the
LINESTfunction. - Define the range of cells containing the known x and y values as the first two arguments of the function.
- Include the argument
TRUEfor additional regression statistics. - Press Enter to calculate the results.
What is the Linest Function in Excel?
The LINEST function in Excel is a statistical tool used to calculate the statistics for a line. It can also be used to calculate the equation of a line from a set of data points. This function can be used to determine the slope and y-intercept of a line, as well as other statistical information such as the standard error of the regression, the R-squared value, and the F-test. The LINEST function is a great tool for analyzing data, and it is a popular choice among Excel users.
The LINEST function can be used to determine the line of best fit for a set of data points. It can also be used to calculate the equation of the line of best fit, which is useful for making predictions and analyzing trends in data. The LINEST function is also useful for determining the correlation between two variables.
How to Use the Linest Function in Excel?
Using the LINEST function in Excel is relatively straightforward. To use the function, you must first enter the data points into a worksheet. Then, select the range of data points that you want to analyze, and enter the LINEST function into a cell. The function will then return the statistics for the line of best fit for the data points.
The syntax for the LINEST function is as follows: =LINEST(known_y’s, known_x’s,
The known_y’s and known_x’s parameters are the ranges of data points that you want to analyze. The
Interpreting the Results of the Linest Function
The LINEST function will return several statistics and parameters for the line of best fit. These parameters include the slope, the y-intercept, the standard error of the regression, the R-squared value, and the F-test.
The slope is the rate at which the line changes as the x-values increase. The y-intercept is the point at which the line crosses the y-axis. The standard error of the regression is a measure of the accuracy of the line of best fit. The R-squared value is a measure of how well the line of best fit fits the data points. The F-test is a measure of how well the line of best fit fits the data points.
Using the Linest Function to Make Predictions
Once you have calculated the equation of the line of best fit, you can use it to make predictions. To do this, you can simply plug in the x-value that you want to predict into the equation and calculate the corresponding y-value.
For example, if you have the equation y = 3x + 2, and you want to predict the y-value for an x-value of 10, you can simply plug 10 into the equation and calculate the answer. In this case, the y-value would be 32.
Using the Linest Function to Analyze Trends
The LINEST function can also be used to analyze trends in data. To do this, you can calculate the equation of the line of best fit for a set of data points, and then use the slope of the line to determine the direction of the trend.
If the slope of the line is positive, then the data points are increasing in value. If the slope of the line is negative, then the data points are decreasing in value. The magnitude of the slope can also be used to determine the strength of the trend.
Advantages and Disadvantages of the Linest Function
The LINEST function is a powerful tool for analyzing data and making predictions. However, it has some drawbacks. One of the drawbacks of the LINEST function is that it only works with linear data. If the data is not linear, then the results of the LINEST function may not be reliable.
Another disadvantage of the LINEST function is that it does not account for outliers. If there are outliers in the data, then the results of the LINEST function may not be accurate.
Conclusion
The LINEST function in Excel is a powerful tool for analyzing data and making predictions. It can be used to calculate the statistics for a line of best fit, as well as the equation of the line. It can also be used to analyze trends in data and make predictions. Despite its advantages, the LINEST function has some drawbacks, such as its inability to account for outliers and its inability to work with non-linear data.
Frequently Asked Questions
What is Linest in Excel?
Linest in Excel is a powerful formula that can be used to calculate the best-fit line for a set of data points. The formula works by calculating the least squares regression line that best fits the data. It can return a number of different parameters including the slope, intercept, and the standard error of the regression line. It can also be used to find the correlation coefficient and the R-squared value. This makes it a useful tool for performing statistical analysis.
What is the Syntax of Linest in Excel?
The syntax for the Linest formula in Excel is: LINEST(known_y’s, known_x’s,
How to Use Linest in Excel?
To use the Linest formula in Excel, you will need to enter the formula into a cell. The formula should include the known_y’s, known_x’s, and any optional parameters. Once the formula has been entered, Excel will calculate the regression line and return the requested values. The resulting values can then be used to analyze the data and make predictions.
What are the Limitations of Linest in Excel?
The Linest formula in Excel has several limitations. It only works with linear regression models, meaning it cannot be used to fit a non-linear regression line. It also cannot be used to calculate the confidence interval for the regression line. In addition, it cannot be used to calculate the prediction interval for the regression line. Finally, it can only be used to calculate a single regression line at a time, so it is not suitable for multi-variable regression models.
What are the Advantages of Linest in Excel?
The Linest formula in Excel has several advantages. It is an easy to use formula that can quickly calculate the best-fit line for a set of data points. It can also calculate several additional statistical parameters, such as the slope, intercept, standard error, correlation coefficient, and R-squared value. This makes it a powerful tool for performing statistical analysis.
What are some Examples of Using Linest in Excel?
Linest in Excel can be used for a variety of applications. It can be used to calculate the best-fit line for a set of data points and analyze the data. It can also be used to analyze trends over time, such as the relationship between stock prices and quarterly earnings. It can also be used to find the correlation between two sets of data, such as the relationship between weight and height. Finally, it can be used to make predictions from a set of data, such as predicting future sales based on previous data.
In conclusion, using lines in Excel is a great way to visually enhance your data and make it easier to interpret. With the right knowledge and practice, you can quickly become an expert in using lines in Excel. Knowing how to use lines in Excel can save you time and help you create better looking spreadsheets.