


How to Use Percentile in Excel?

Are you looking for a way to use percentile in Excel? With a few simple steps, you can quickly and easily use percentiles to analyze your data. In this guide, we’ll show you how to use percentile in Excel and explain why it’s important for data analysis. We’ll also provide examples of how you can use this feature to make your data analysis easier and more accurate. Get ready to take your Excel skills to the next level!
To use percentile in Excel, follow these steps:
- Open the Excel worksheet and enter the required data into the spreadsheet.
- Select the data and click on the ‘Formulas’ tab.
- Now, click on the ‘Statistical’ option and select the PERCENTILE function from the menu.
- Enter the data range in the function window, followed by the percentile value.
- You can also add the optional ‘k’ parameter to the function.
- Finally, click ‘OK’ and the percentile will be calculated in the selected cell.
What is Percentile in Excel?
A percentile in Excel is a measure used in statistics to indicate the value below which a specified percentage of observations in a group of observations falls. For example, the 95th percentile would indicate the value below which 95% of the observations in a given group of observations fall. This measure is useful for understanding the distribution of values within a given data set.
In Excel, percentile calculations can be used to determine the relative ranking of an individual data point compared to the rest of the data set. This measure can be used to identify outliers or to compare individual values to the rest of the data set. It is important to note that percentile calculations are not the same as percentages.
How to Calculate Percentile in Excel?
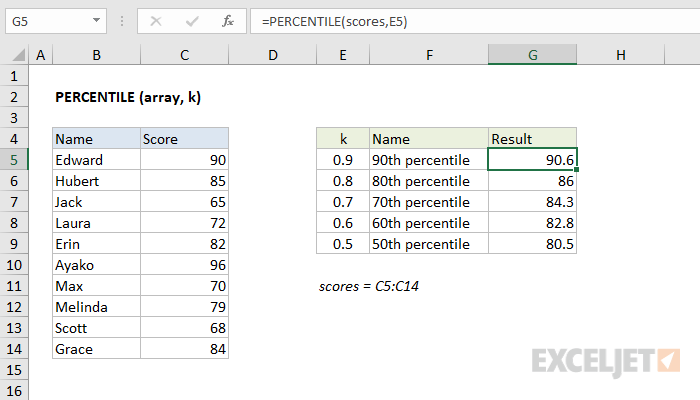
To calculate the percentile of a given value in Excel, you must first use the PERCENTILE function. This function takes two arguments: a range of values, and the percentile value that you want to calculate. The PERCENTILE function will return the value below which the given percentile of the data set falls.
For example, if you have a range of values in cells A1 to A10, you can use the PERCENTILE function to calculate the 90th percentile of that range by using the following formula:
=PERCENTILE(A1:A10,0.90)
This formula will return the value below which 90% of the values in the given range fall.
Using the PERCENTILE.INC Function
In some cases, you may want to calculate the percentile of a given value using the PERCENTILE.INC function. This function is similar to the PERCENTILE function, but it can be used to calculate the percentile of a given value that is included in the range of values.
For example, if you have a range of values in cells A1 to A10, and you want to calculate the percentile of the value in cell A5, you can use the PERCENTILE.INC function to calculate the percentile of that value by using the following formula:
=PERCENTILE.INC(A1:A10,A5)
This formula will return the percentile of the value in cell A5.
Using the PERCENTRANK Function
The PERCENTRANK function can be used to calculate the relative ranking of a given value compared to the rest of the data set. This function takes two arguments: a range of values, and the value for which you want to calculate the percentile rank.
For example, if you have a range of values in cells A1 to A10, and you want to calculate the percentile rank of the value in cell A5, you can use the PERCENTRANK function to calculate the percentile rank of that value by using the following formula:
=PERCENTRANK(A1:A10,A5)
This formula will return the percentile rank of the value in cell A5.
Using the PERCENTILE Formula
In addition to the PERCENTILE, PERCENTILE.INC, and PERCENTRANK functions, you can also use the PERCENTILE formula to calculate the percentile of a given value. This formula takes two arguments: a range of values, and the percentile value that you want to calculate.
For example, if you have a range of values in cells A1 to A10, and you want to calculate the 90th percentile of that range, you can use the PERCENTILE formula to calculate the percentile of that range by using the following formula:
=PERCENTILE(A1:A10,0.90)
This formula will return the value below which 90% of the values in the given range fall.
Using the PERCENTILE.EXC Function
The PERCENTILE.EXC function can be used to calculate the percentile of a given value that is excluded from the range of values. This function takes two arguments: a range of values, and the percentile value that you want to calculate.
For example, if you have a range of values in cells A1 to A10, and you want to calculate the 90th percentile of that range excluding the value in cell A5, you can use the PERCENTILE.EXC function to calculate the percentile of that range by using the following formula:
=PERCENTILE.EXC(A1:A10,0.90)
This formula will return the value below which 90% of the values in the given range fall, excluding the value in cell A5.
Using the PERCENTRANK.EXC Function
The PERCENTRANK.EXC function can be used to calculate the relative ranking of a given value compared to the rest of the data set, excluding the value itself. This function takes two arguments: a range of values, and the value for which you want to calculate the percentile rank.
For example, if you have a range of values in cells A1 to A10, and you want to calculate the percentile rank of the value in cell A5 excluding that value, you can use the PERCENTRANK.EXC function to calculate the percentile rank of that value by using the following formula:
=PERCENTRANK.EXC(A1:A10,A5)
This formula will return the percentile rank of the value in cell A5, excluding that value.
Frequently Asked Questions
Q1. What is Percentile in Excel?
A1. Percentile in Excel is a statistical measure used to show the relative standing of a particular value within a set of values. It is expressed as a percentage value between 0 and 100, with 0 representing the lowest value and 100 representing the highest value. The percentile value is calculated by dividing the position of the value in the data set by the total number of values in the set and multiplying the result by 100. For example, if a particular value is at the 5th position in a set of 100 values, the percentile value of that value would be 5%. Percentile is used to compare a value with the rest of the values in a data set to determine its relative standing.
Q2. How to Calculate Percentile in Excel?
A2. Calculating percentile in Excel is easy. To calculate the percentile value for a specific value in a data set, simply use the PERCENTILE() function. This function takes two arguments: the data set and the percentile value to be calculated. For example, to calculate the 90th percentile value in a data set, the PERCENTILE() function would be written as PERCENTILE(data_set, 0.90). This function will then return the percentile value for the specified data set and percentile value.
Q3. What is Percentile Rank in Excel?
A3. Percentile rank in Excel is a measure of the relative standing of a particular value in a data set. It is expressed as a percentage value between 0 and 100, with 0 representing the lowest value and 100 representing the highest value. The percentile rank is calculated by dividing the position of the value in the data set by the total number of values in the set and multiplying the result by 100. For example, if a particular value is at the 5th position in a set of 100 values, the percentile rank of that value would be 5%. Percentile rank is used to compare a value with the rest of the values in a data set to determine its relative standing.
Q4. How to Calculate Percentile Rank in Excel?
A4. Calculating percentile rank in Excel is easy. To calculate the percentile rank for a specific value in a data set, simply use the PERCENTRANK() function. This function takes two arguments: the data set and the percentile rank value to be calculated. For example, to calculate the 90th percentile rank value in a data set, the PERCENTRANK() function would be written as PERCENTRANK(data_set, 0.90). This function will then return the percentile rank value for the specified data set and percentile rank value.
Q5. What is Percentile Graph in Excel?
A5. Percentile graph in Excel is a graph that is used to visualize the relative standing of a particular value within a set of values. It is expressed as a percentage value between 0 and 100, with 0 representing the lowest value and 100 representing the highest value. The percentile graph is created by plotting the percentile values of each value in the data set on the x-axis and the corresponding values on the y-axis. This graph can be used to quickly compare values in a data set and identify outliers or trends.
Q6. How to Create a Percentile Graph in Excel?
A6. Creating a percentile graph in Excel is easy. To create the graph, first calculate the percentile values for each value in the data set using the PERCENTILE() function. Then, plot the percentile values on the x-axis and the corresponding values on the y-axis. Finally, add lines or curves to the graph to identify outliers or trends. Once the graph is created, it can be used to quickly compare values in a data set and identify outliers or trends.
In conclusion, percentile in Excel can be a powerful tool used to quickly and easily calculate the rank of a given set of values. With just a few clicks, you can easily sort and analyze data, making it much easier to identify trends and make informed decisions. Excel’s percentile function is a must-have tool for anyone who needs to make sense of their data.