


How to Use Power Bi Desktop?

Are you looking to get the most out of your data? Power BI Desktop can help you do just that! Power BI Desktop is a powerful data visualization tool that allows you to explore and analyze your data in a comprehensive manner. This article will provide you with a step-by-step guide on how to use Power BI Desktop and get the most out of your data. You’ll learn how to create powerful visuals, explore and analyze your data, and share your insights with others. With Power BI Desktop, you can unlock the potential of your data to gain valuable insights. So, let’s get started!
How to Use Power BI Desktop?
- Download and install Power BI Desktop from the Microsoft website.
- Sign in to Power BI Desktop with your Microsoft account.
- Create a data source connection to your data.
- Build a data model with tables, columns, and relationships.
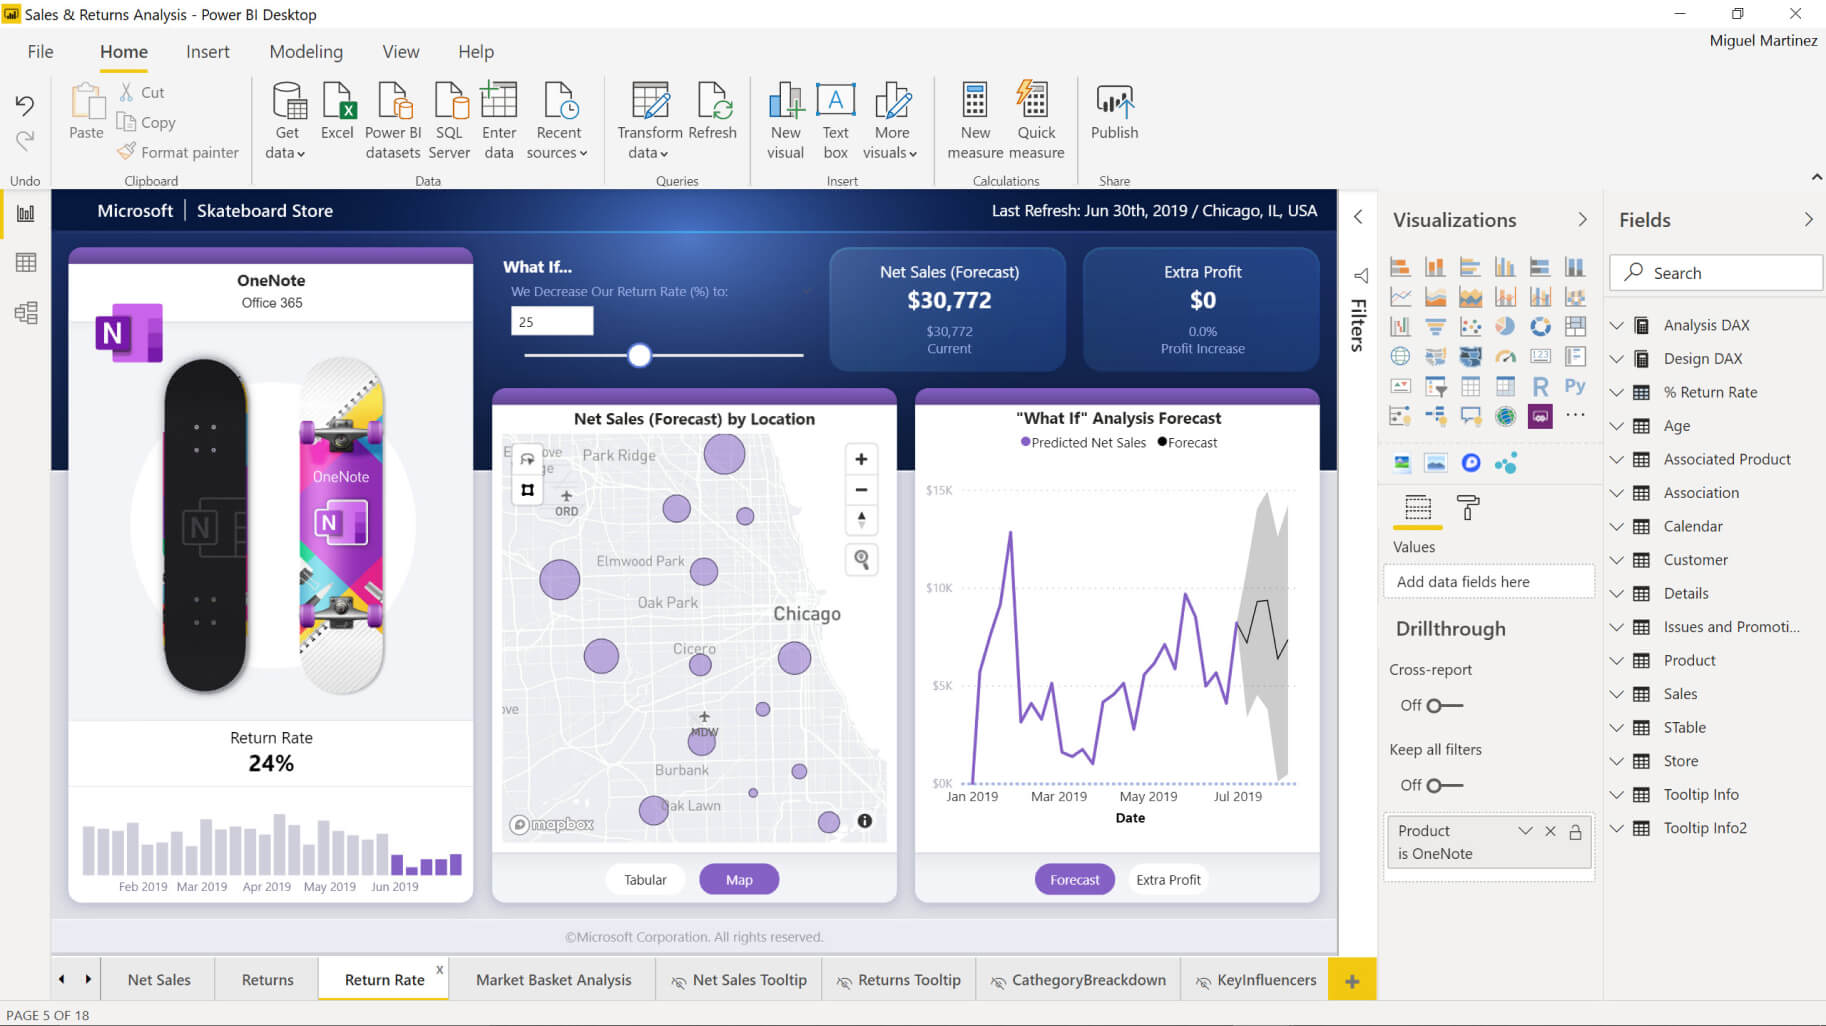
- Create visualizations of your data such as charts, maps, and tables.
- Share your reports with colleagues.
What is Power BI Desktop?
Power BI Desktop is a powerful business intelligence tool that enables users to explore, analyze, and visualize data quickly and easily. With its drag-and-drop interface and intuitive features, Power BI Desktop provides an easy-to-use platform for analyzing and visualizing data. It also allows users to create custom dashboards and reports, as well as share them with others.
Power BI Desktop is available for both Windows and Mac OS X, and is available as a free download from the Microsoft website. It is also available for purchase as part of the Office 365 suite.
Getting Started with Power BI Desktop
The first step in getting started with Power BI Desktop is to download and install the software. Once the download is complete, users can launch the program and begin creating reports.
The first step is to connect to a data source. Power BI Desktop supports a variety of data sources, including relational databases, flat files, and web services. Users can also connect to online sources such as Salesforce and Azure. After connecting to a data source, users can begin exploring the data.
The next step is to create visualizations. Power BI Desktop offers a variety of visualization options, including charts, tables, maps, and more. Users can customize the visualizations to meet their needs.
Creating Reports
Once users have created their visualizations, they can begin creating reports. Reports can be created from scratch or from existing visualizations. Reports can be customized to include different elements, such as text, images, and graphs. Reports can also be shared with other users.
Publishing Reports
When users are satisfied with their report, they can publish it to the web. This allows users to share their report with a wider audience. Reports can also be embedded in other websites and applications.
Managing Data with Power BI Desktop
Power BI Desktop also allows users to manage their data. Users can import data from different sources, combine and transform data, and clean up data. Users can also create custom queries to filter and analyze data.
Creating Dashboards
Users can also create custom dashboards with Power BI Desktop. Dashboards can be used to quickly analyze and visualize data. Dashboards can include charts, tables, and other visualizations.
Sharing and Collaboration
Power BI Desktop also allows users to share and collaborate with others. Users can create shared datasets and dashboards that can be accessed by other users. This makes it easy for teams to work together and share insights.
Conclusion
Power BI Desktop is a powerful business intelligence tool that makes it easy to explore, analyze, and visualize data. With its intuitive features and drag-and-drop interface, users can quickly create reports, dashboards, and visualizations. Power BI Desktop also allows users to manage their data, share and collaborate with others, and publish reports to the web.
Frequently Asked Questions
What is Power BI Desktop?
Power BI Desktop is a powerful business analytics tool from Microsoft that allows users to collect, connect, and analyze data from a wide range of sources. With Power BI Desktop, users can create interactive dashboards and reports, share insights, and collaborate with others. It is a self-service, drag-and-drop analytics platform that is available for free.
What are the Benefits of Using Power BI Desktop?
Using Power BI Desktop, users can easily collect, connect, and analyze data from multiple sources. This enables them to gain a deeper insight into their business and make more informed decisions. Additionally, Power BI Desktop allows users to create interactive dashboards, reports, and visualizations, which enable them to quickly identify trends and spot opportunities. Furthermore, Power BI Desktop is easy to use and can be shared with others, allowing users to collaborate and gain insights from the collective knowledge of the team.
What Data Sources can I Connect to Power BI Desktop?
Power BI Desktop can connect to a wide range of data sources such as files, databases, and cloud services. Additionally, it has powerful data transformation capabilities that allow users to clean and transform their data for analysis. Some of the most popular data sources that can be connected to Power BI Desktop include Excel, CSV, JSON, XML, and ODBC.
How do I Get Started with Power BI Desktop?
Getting started with Power BI Desktop is easy. First, download and install the software. Once installed, you will be taken through a setup wizard where you will be asked to connect to a data source. Once you have connected to your data source, you will be able to explore the data and create visualizations. Additionally, you can use the drag-and-drop feature to create interactive dashboards and reports.
What are the Features of Power BI Desktop?
Power BI Desktop has many features that make it a powerful business analytics tool. It includes a wide range of data connectors, powerful data transformation capabilities, interactive dashboards, reports, and visualizations. Additionally, it has natural language search, collaboration and sharing features, and powerful insights.
How do I Share my Power BI Desktop Reports?
Sharing your Power BI Desktop reports is easy. You can share them directly with other users or publish them to the Power BI Service. When publishing to the Power BI Service, users can control who has access to the report and what level of access they have. Additionally, you can easily embed your reports into other applications or websites for easy sharing and collaboration.
How to use Microsoft Power BI – Tutorial for Beginners
Power BI desktop is a powerful analytical tool that enables you to explore data from multiple sources, create interactive visualisations, and unlock insights from your data. With Power BI desktop, you can easily create custom reports and dashboards that help you make the most of your data. With the help of Power BI desktop, you can gain meaningful insights from your data quickly and efficiently. With its intuitive user interface and powerful capabilities, Power BI Desktop is an ideal tool for data analysis.