


Why Power Bi is Better Than Excel?

Excel is a great tool for data analysis, but it has its limitations. If you are looking for a more powerful platform to help you analyze your data, Power BI is the answer. The advanced features and capabilities of Power BI make it a superior choice for businesses and individuals alike. In this article, we will discuss why Power BI is a better choice than Excel for data analysis and why you should consider switching over.
Power BI is better than Excel for data analysis and visualization due to its interactive and user-friendly features. Power BI is faster and more efficient than Excel, allowing users to connect to large data sets, explore and analyze data quickly, and create interactive visualizations with ease. It also offers advanced analytics, integration with other Microsoft products, and scalability, making it easier to create powerful reports and dashboards.
Why Power BI is a Powerful Tool for Data Analysis
Power BI is a powerful data analysis and visualization tool that is becoming increasingly popular for businesses of all sizes. It is used to analyze and present data in powerful ways that are not possible in Excel. It provides advanced features such as data modeling, data visualization, reporting, and analytics that are not available in Excel. Power BI also allows for data transformations and data cleansing to ensure that the data is clean and accurate.
Power BI also offers a variety of data sources, allowing users to connect to a range of data sources from cloud sources such as Salesforce, Google Analytics, and Amazon Redshift, to on-premise sources such as Microsoft SQL Server, Oracle, and SAP HANA. This allows users to access the data they need quickly and easily. Power BI also offers multiple ways to explore and analyze the data, including interactive visualizations, drill down features, and advanced analytics.
Additionally, Power BI is designed to be user-friendly, with a simple drag-and-drop interface and intuitive features, making it easy to use and understand. This makes Power BI a great option for users who are new to data analysis. Power BI also offers a range of features to help users collaborate and share their insights, such as dashboards, reports, and interactive data stories.
Power BI Offers Advanced Data Modeling and Visualization Features
Power BI’s advanced data modeling and visualization features make it a powerful tool for exploring and analyzing data. Power BI offers a range of features to help users build powerful data models, such as the ability to combine multiple data sources into one, create relationships between data points, and apply calculations. Power BI also offers a variety of data visualization options to help users tell engaging stories with their data, such as interactive charts, maps, and graphs.
Additionally, Power BI’s data modeling and visualization features make it easy to find insights in the data. Power BI’s data exploration tools, such as natural language queries and predictive analytics, allow users to quickly and easily uncover insights in their data. Power BI also offers advanced analytics capabilities, such as machine learning and artificial intelligence, to help users gain deeper insights into their data.
Power BI Is More Flexible Than Excel
Power BI is more flexible than Excel in terms of data sources and data analysis. As mentioned previously, Power BI offers a wide range of data sources and allows users to connect to multiple sources at once. Additionally, Power BI allows users to explore and analyze their data in a variety of ways, including interactive visualizations, drill down features, and advanced analytics.
In comparison, Excel is limited in terms of data sources and data analysis. Excel only allows users to connect to a single data source at a time, and the data analysis features are limited. Additionally, Excel is limited in terms of data visualization, as the visualizations are static and can’t be interacted with.
Power BI Is Easier to Use Than Excel
Power BI is designed to be easy to use and understand, making it a great option for users who are new to data analysis. Power BI’s drag-and-drop interface and intuitive features make it easy to use and understand. Additionally, Power BI offers a range of features to help users collaborate and share their insights, such as dashboards, reports, and interactive data stories.
In comparison, Excel can be difficult to use and understand, especially for those who are new to data analysis. Excel can be time consuming to use and the features are often difficult to understand. Additionally, Excel does not offer any features to help users collaborate and share their insights.
Few Frequently Asked Questions
Question 1: What is Power BI?
Answer: Power BI is a business intelligence and analytics platform from Microsoft that provides users with a variety of features such as interactive data visualizations, predictive analytics, and predictive modeling. It allows users to turn data into insights and actionable decisions. It also offers features for data transformation, data integration, and data enrichment. Power BI can be accessed from the web, desktop, and mobile devices, giving users the ability to access their data and insights anywhere and anytime.
Question 2: How is Power BI better than Excel?
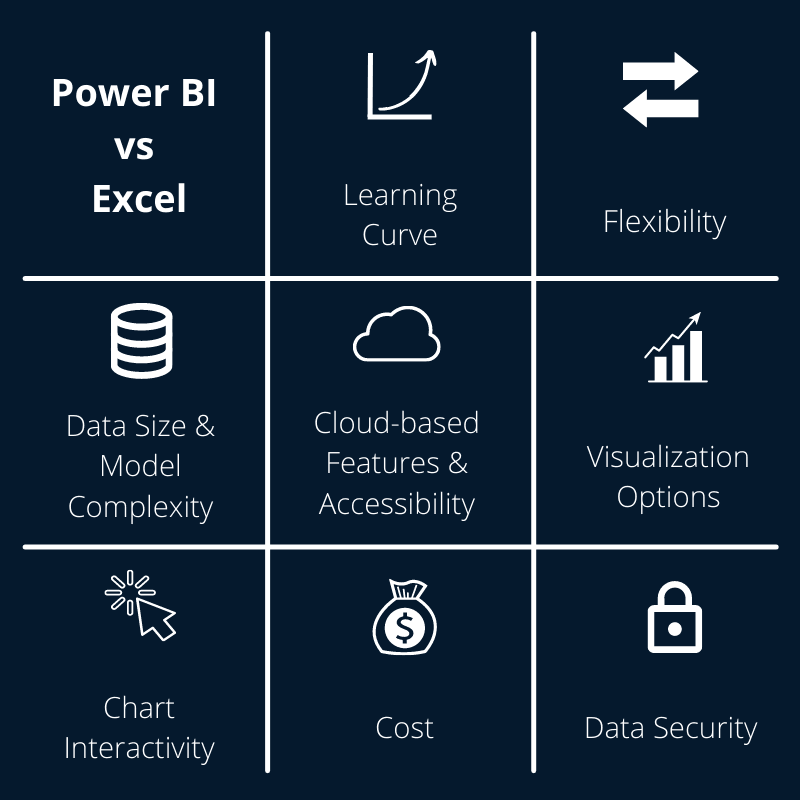
Answer: Power BI is more powerful than Excel in several ways. It is able to handle larger datasets with more complex data relationships than Excel. Power BI also offers more advanced analytics capabilities such as predictive analytics, data transformation, and data enrichment. Additionally, the visuals in Power BI are more interactive and visually appealing than those in Excel. Power BI also offers integration with other Microsoft applications such as SharePoint and Dynamics 365.
Question 3: What type of data can I analyze with Power BI?
Answer: Power BI can analyze a variety of data sources such as relational databases, text files, and cloud-based sources. It is also capable of connecting to other sources such as Azure and Google Analytics. Additionally, Power BI can process data from many different sources simultaneously, allowing users to access insights from disparate data sources.
Question 4: Does Power BI require any programming knowledge?
Answer: Power BI does not require any programming knowledge. It has a user-friendly interface and it is easy to learn. Most of the features and functions of the platform can be accessed without any coding. However, some advanced features may require a deeper understanding of coding languages such as DAX.
Question 5: What are some of the features offered by Power BI?
Answer: Power BI offers a variety of features for data analysis and visualization. These include interactive data visualizations, predictive analytics, data transformation, data integration, and data enrichment. It also offers features for creating dashboards and sharing insights with others. Additionally, Power BI is capable of connecting to other applications such as SharePoint and Dynamics 365.
Question 6: How much does Power BI cost?
Answer: Power BI is available in three different pricing plans: Free, Pro, and Premium. The Free plan is available for individual users and offers limited features. The Pro plan is available for businesses and offers access to advanced features. The Premium plan is available for enterprise users and offers access to the full suite of Power BI features. The cost of the Pro and Premium plans vary depending on the number of users and the type of features needed.
Excel vs Power BI – What’s the difference?
In conclusion, Power BI is the clear winner when it comes to data analysis and visualization. With its powerful visualizations and analytics capabilities, Power BI can help businesses make more informed decisions and improve their overall performance. It also offers a range of features that Excel cannot match, such as real-time data updates, predictive analytics, and natural language queries. With its ability to quickly process and analyze large amounts of data, Power BI is the perfect choice for any business looking to get the most out of their data.