


Why Choose Power Bi?

Power BI is a powerful data visualization and business intelligence tool that can help you make sense of your data and make smarter decisions. It allows you to quickly and easily create interactive reports and dashboards that showcase your data in a visually compelling way. With Power BI, you can quickly identify key trends, gain insights, and make better decisions based on your data. In this article, we’ll discuss why Power BI is an excellent choice for data visualization and business intelligence. We’ll highlight its features, benefits, and how it can help you take your business to the next level.
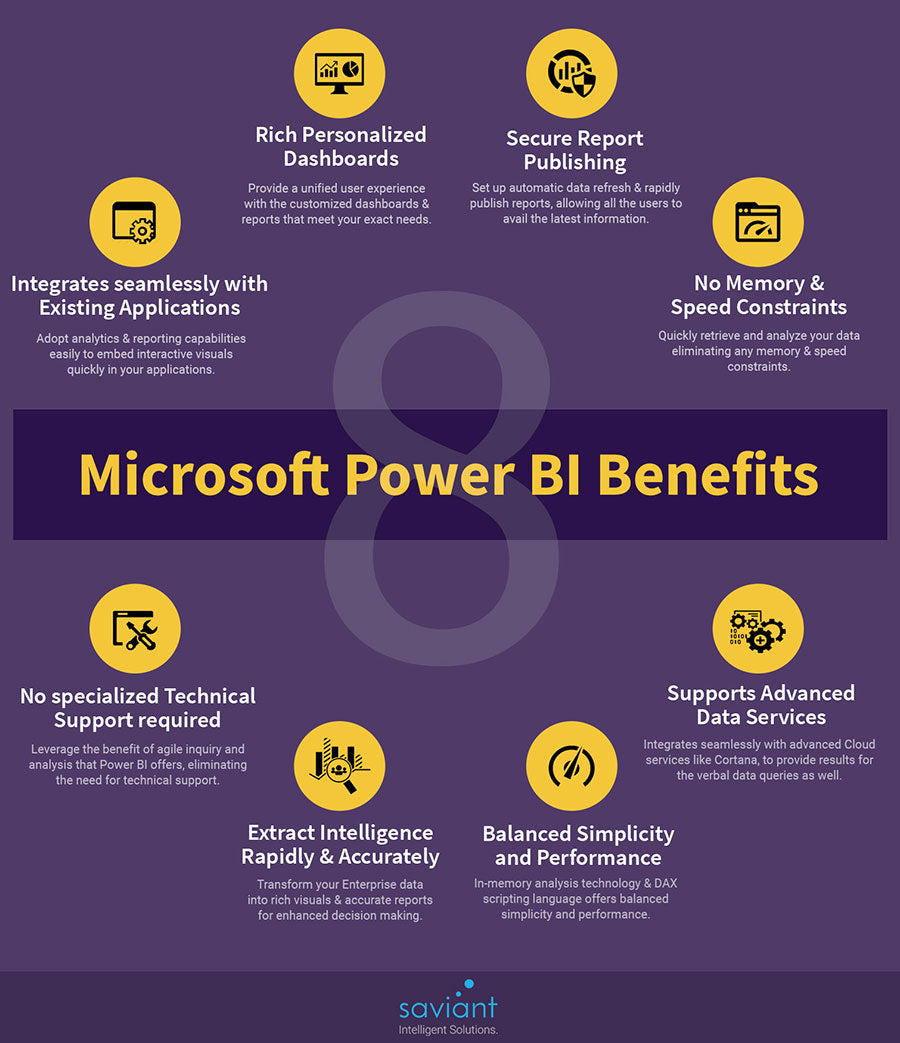
- Power BI is user-friendly, easy to use, and provides an interactive experience for users.
- It can connect to multiple data sources, allowing users to analyze data from different sources in one place.
- Power BI has predictive analytics capabilities, allowing users to predict future trends and patterns in data.
- It has a comprehensive set of visualization tools, allowing users to create dynamic and interactive visuals.
- Power BI integrates with other Microsoft products, such as Excel, allowing users to access and analyze data from other Microsoft applications.
- It is cost-effective, allowing users to save money while still getting the most out of their analytics.
What is Power BI?
Power BI is Microsoft’s business intelligence platform. It’s an analytics system that simplifies the process of collecting, organizing, analyzing, and visualizing data. It allows users to create interactive dashboards, reports, and visuals that can be shared with others. Power BI is designed to be a comprehensive, end-to-end solution for data analysis and reporting.
Power BI offers a range of features and tools that make it a powerful solution for businesses. It’s an easy-to-use tool that allows users to quickly analyze and visualize data from a variety of sources. It also provides powerful visualizations and insights that can be used to gain valuable insights into a business.
Powerful Visualizations
Power BI offers a range of powerful visualizations that can help businesses gain insights from their data. It’s easy to create and customize visuals to meet the needs of a particular project. Power BI also provides a range of data visualizations, including bar charts, line graphs, scatterplots, and more. These visualizations can be used to quickly identify trends and relationships in data.
Power BI also provides powerful filtering and sorting tools that allow users to quickly focus on specific data points. This can help users quickly identify patterns and relationships in their data. It also offers a range of data exploration tools, such as the ability to drill down into data and create custom filters.
Data Integration and Analysis
Power BI also offers powerful data integration and analysis capabilities. It’s easy to connect to a variety of data sources, including web services, databases, and files. This allows users to quickly analyze data from multiple sources and create insights.
Power BI also provides a range of analysis tools, including data mining, predictive analytics, and machine learning. These tools can help users quickly identify trends and relationships in their data. They can also be used to create predictive models and insights.
Data Security and Sharing
Power BI offers powerful data security features that help protect data from unauthorized access. It also provides a range of data sharing options, including the ability to securely share data with others. This allows users to quickly share insights with colleagues and customers.
Power BI also provides a range of data governance features. These features help ensure that data is properly managed and protected. They can also be used to ensure that data is securely stored and that data is accessed only by authorized users.
Powerful Dashboards and Reports
Power BI also offers powerful dashboards and reporting capabilities. It’s easy to create interactive dashboards and reports that can be shared with others. These dashboards and reports can be used to quickly identify trends and relationships in data.
Power BI also provides a range of reporting features, including the ability to create custom reports and visualizations. These reports can be used to quickly identify insights and trends in data. It also provides a range of data visualization tools, including heat maps, geographic maps, and more.
Integration with Microsoft Office
Power BI also integrates with Microsoft Office, allowing users to quickly access and analyze data from Microsoft Excel, Outlook, and other Office applications. This integration makes it easy to access and analyze data from multiple sources. It also allows users to quickly create reports and visuals that can be shared with others.
Intuitive and Easy to Use
Power BI is an easy-to-use tool that makes it easy to quickly analyze and visualize data. It’s also intuitive and user-friendly, making it a great choice for businesses of all sizes. It’s also a cost-effective solution, as it’s available for a monthly subscription fee.
Robust Support and Resources
Power BI also offers robust support and resources. It’s easy to find answers to questions or troubleshoot issues. Microsoft also provides a range of resources, including tutorials, webinars, and more. This makes it easy to get started with Power BI and quickly become an expert.
Few Frequently Asked Questions
What is Power BI?
Power BI is a business intelligence (BI) platform developed by Microsoft. It is used to connect to data from multiple sources, transform and clean the data, and visualize it in the form of interactive dashboards and reports. It is designed to help users quickly and easily make sense of their data and to enable data-driven decision-making.
What are the benefits of using Power BI?
The main benefits of using Power BI include:
1. Easy Connectivity: Power BI allows users to connect to a variety of data sources, including cloud services, on-premise databases, and Excel files.
2. Clean Data: Power BI automatically cleans and transforms the data, removing errors and making the data more useful.
3. Visualization: Power BI provides a wide range of visualizations, including charts, tables, and maps, which makes it easier to understand and analyze data.
4. Collaboration: Power BI makes it easy to share dashboards and reports with colleagues, enabling collaboration and data-driven decision-making.
5. Automation: Power BI can be used to automate tasks, including data refreshes and report generation, making it easier to keep data up-to-date.
6. Security: Power BI provides a secure environment for data storage and access, ensuring that data is kept secure and confidential.
Why should I choose Power BI?
Power BI is a powerful and intuitive business intelligence platform that enables users to quickly and easily make sense of their data and to enable data-driven decision-making. It is easy to connect to a variety of data sources, clean and transform the data, and visualize it in the form of interactive dashboards and reports. Additionally, it allows users to share dashboards and reports with colleagues, automate tasks, and keep data secure and confidential. All of these features make Power BI an ideal choice for organizations looking to make the most of their data.
What features does Power BI offer?
Power BI offers a wide range of features to help users make the most of their data. These features include:
1. Connectivity: Power BI allows users to easily connect to data from multiple sources, including cloud services, on-premise databases, and Excel files.
2. Clean Data: Power BI automatically cleans and transforms data, removing errors and making the data more useful.
3. Visualization: Power BI provides a wide range of visualizations, including charts, tables, and maps, which makes it easier to understand and analyze data.
4. Collaboration: Power BI makes it easy to share dashboards and reports with colleagues, enabling collaboration and data-driven decision-making.
5. Automation: Power BI can be used to automate tasks, including data refreshes and report generation, making it easier to keep data up-to-date.
6. Security: Power BI provides a secure environment for data storage and access, ensuring that data is kept secure and confidential.
Is Power BI expensive?
Power BI is available in a variety of plans, ranging from free to more expensive plans. The free plan includes basic features, while more expensive plans provide access to additional features, including enterprise-level features. Additionally, some organizations may be eligible for discounts.
Is Power BI easy to use?
Yes, Power BI is designed to be intuitive and easy to use. It provides a range of features that make it easy to connect to data from multiple sources, clean and transform data, and visualize it in the form of interactive dashboards and reports. Additionally, it provides step-by-step tutorials and online resources to help users get started quickly and easily.
Where can I find more information about Power BI?
More information about Power BI can be found on the Microsoft website, as well as on other websites and forums. Additionally, there are a number of online resources, including tutorials, blogs, and forums, which provide useful insights and advice on how to make the most of Power BI.
Should You Learn Power Bi? Everything You Need To Know
Power BI is an incredibly powerful and versatile business intelligence and analytics tool, offering value to any organization that uses it. With its ability to quickly connect to and analyze a wide variety of data sources, Power BI allows users to gain meaningful insights from their data faster than ever before. With its intuitive drag-and-drop interface, users can create and share interactive visualizations with ease, helping to make complex data easier to understand. Power BI also offers a wide range of features, from automated insights to natural language query, to help users find the best solution for their data analysis needs. With all these benefits, it’s no wonder that Power BI is quickly becoming the go-to choice for data analysis and business intelligence.