


Events and Reliability Troubleshooting in windows 11 and windows 10

Events and Reliability Troubleshooting
When you want to diagnose a problem or an issue in Windows, there’s good news, as there’s almost nothing that happens on a PC without being logged and recorded. No, I’m not talking about the National Security Agency (NSA) or the Chinese Ministry of State Security (MSS) spying on your online activities as if I’m honest I doubt the Chinese government is really that concerned about how many cat videos you search for on YouTube or the cookery tutorials you subscribe to on TikTok (let’s see how well this book ages with the TikTok reference; Ed).
Windows doesn’t spy on you either, so you don’t need to worry about the operating system keeping records of your private correspondence. If you are concerned about your online privacy though, I can highly recommend the book Windows 11 Made Easy (Apress, 2022) which has a great resource on maintaining your online safety and privacy. I know this because I wrote it.
It's not just recording events and other activities on the PC though so you can refer back to them later and find the cause of a problem, the real-time reporting of what is happening on a PC is just superb, and you can drill down into the smallest process or activity to see in great detail what’s going on. This can be especially useful when diagnosing something like a malware infection or a piece of software that’s chewing all of your available bandwidth (Adobe Creative Cloud updater, I’m looking at you). The tools available in Windows to be able to see all this information are many and varied, but they’re by far the most important tools for any IT Pro or troubleshooter, so in this chapter we’re going to look at them in great detail and see just how they can be harnessed.
Reliability History
We’ll begin with one of the most basic yet one of the most useful, the Reliability History. This tool is also one of the best hidden as you won’t find it in either Settings or Windows Tools, and it can be found as a link under Security and Maintenance in the Control Panel, but a Start Menu search will display it quickly enough.
The Reliability History contains two panels: one is a timeline of days over the last few weeks, and in the bottom is information about events in the currently highlighted day (see Figure 8-1).
 Figure 8-1. The Reliability History highlights event types in color
You can move back and forward dates by clicking the back and forward arrows to the left and right of the dates panel, though remember that Windows typically keeps its event data for only 30 days to avoid filling your hard drive with files you don’t need.
Each event is highlighted with a different type of icon. The red circular icon with an X in its center is for the critical events; these include things such as driver and service crashes. The yellow warning triangle is for warnings when something has failed, but it’s not going to affect the PC critically, such as an unsuccessful Windows Update installation which can later be retried. Lastly, there are informational events which are indicated by a blue circular information icon, the type of which you might see at a roadside on a sign giving tourist advice.
For many events, but not always all critical events, there is a View technical details link to their right in the information panel. Clicking this will display technical information about the event. In Figure 8-2, we can see that on my own PC a game I have played for years and love dearly, Elite Dangerous, has crashed.
 Figure 8-2. You can get highly useful technical details about events
We can see the date and time the game crashed; there is a verbose description of the event along with the name of the offending file EliteDangerous64.exe, though this could also display the name of a Windows or third-party service or driver depending on the error. We can see the full path of the file, and you might see other information such as a Windows error code.
Tip:Windows error codes always come in the format 0x00… which makes them unique and easy to search for online. There are a great many error code categories, and the full list can be found on the Microsoft Docs website.
Windows 11 will automatically report many errors directly to Microsoft so that they can perhaps be fixed in an upcoming patch or new driver release. If you click the View all problem reports link at the bottom of the Reliability Monitor window, you will see all the reports that have been submitted (see Figure 8-3).
 Figure 8-3. Windows auto-submits problem reports to Microsoft
It is not possible to disable all diagnostic feedback to Microsoft as much of it used to determine the operating system, software, and driver state so that the correct Windows Updates can be downloaded and installed, but there is some control you can get in Settings ➤ Privacy & security ➤ Diagnostics & feedback (see Figure 8-4), such as the sending of “optional” diagnostic data.
 Figure 8-4. You can control what data is sent to Microsoft in Settings
In the bottom-left corner of the Reliability History window is a Save reliability history link, and you can click this to save a full copy of the current history as an XML file that can then be emailed to a support person such as yourself and viewed in a web browser.
Where the Reliability History comes in useful is for quickly being able to view the major events on a PC, such as when Windows Updates or antivirus definitions were downloaded and installed or when drivers, services, or applications crash or fail to work as intended. It’s possible for an end user to open this panel, if they know on what day a problem occurred and read the basic information to you over the phone or by message, which can be considerably more effective than trying to get a nontechnical person to describe what they saw and experienced.
Getting Reliability Information with PowerShell
If you want to use scripting to manage your PCs, you can use PowerShell commands to get reliability information. This script can be used to generate basic reliability information:
Get-Ciminstance Win32_ReliabilityStabilityMetrics | Measure-Object -Average -Maximum -Minimum -Property systemStabilityIndex
There is also a very interesting developer blog on the Microsoft website showing how you can harness the Get-Ciminstance PowerShell command to obtain all manner of useful reliability information about a PC.
Performance Monitor
Where the Reliability History is useful for seeing reports on what’s happened on the PC in the past, the Performance Monitor is great for seeing what’s going on at that exact moment, and while it’s not the only tool in town, its graphing capabilities are useful for seeing where some resource on the PC is being hogged or maxed out by a process or service.
You can run the Performance Monitor either from Windows Tools, by searching for it in the Start Menu, or by typing perfmon /rel from the Command Line.
In the main Performance Monitor view, you get overview information about the memory, network, disk, and processor use on the PC (see Figure 8-5), but you can drill down much further.
 Figure 8-5. Performance Monitor provides useful information on the current status of the PC
Clicking Performance Monitor under Monitoring Tools in the left panel will display a real-time graph that will display the current processor usage (see Figure 8-6). At the top of the graph though is a toolbar that allows you to customize the view, and the real-time data that it can provide can be incredibly useful.
 Figure 8-6. Real-time data about the PC can be viewed as a graph
If you click the green plus (+) icon at the top of the graph, you can choose from hundreds of additional graphs to display (see Figure 8-7). These cover all aspects of the hardware including networking, memory, disk, and processor.
 Figure 8-7. You can add hundreds of additional graphs to the live view
If you are unsure about what any of the options are you can add, click the Show description check box in the bottom-left corner of the window, and a verbose description will appear about the currently highlighted item.
With your other graphs added, they will display as color-coded lines in the main graph view (see Figure 8-8). At the bottom of the Performance Monitor window are descriptions of what each graph line represents.
 Figure 8-8. Graphs are color-coded so you can tell them apart
You may find that some of the graphs are difficult to see, such as in Figure 8-8 where one of the networking graphs appears in yellow on a white background. If you double click the item in the bottom panel, you can choose other options for that graph, such as changing its color, line thickness, and style (see Figure 8-9).
 Figure 8-9. You can change the color and style of graphs
When you want to remove or hide a graph line, there are two ways to do so. You can either uncheck the box next to the item in the bottom panel, which will cause it to no longer be displayed, but will give you the option of reactivating it later, or you can click the red cross (X) icon in the toolbar to remove the currently selected graph item.
If you want to quickly highlight a specific graph, then select it in the bottom panel and then click the pen icon in the toolbar. This will highlight that graph, making it much easier for you to see (see Figure 8-10).
 Figure 8-10. You can quickly highlight a specific graph
Another useful tool in the Performance Monitor is the Freeze Display button which you will see represented by a pause icon in the toolbar. This will freeze the graph at that point so you can see in more detail what’s going on.
Resource Monitor
While the Performance Monitor is great for giving you a general overview of aspects of your PC’s hardware where you might be hitting a bottleneck, if you need to really drill down into what’s going on the Resource Monitor has all the information you need.
You can open it from Windows Tools, or from a search in the Start Menu, and the Resource Monitor really does give you fine and granular information on everything happening on the PC at the time. The default view is based around collapsible panels on the left side and live graphs on the right (see Figure 8-11).
 Figure 8-11. The Resource Monitor is based around collapsible information panels
Along the top of the window are tabs for Overview, CPU, Memory, Disk, and Network. The main overview panel will show you general information about running processes, disk read and write operations, overall network activity, and what processes are currently using what and how much memory each of the running processes is using.
Similarly, the graphs on the right side of the window will show you CPU, Disk, Network, and Memory usage and make it simple to see where there is a lot of activity or none at all.
Click the CPU tab, and all the running processes and services on the PC are listed in their own panels (see Figure 8-12). You can check the box to the left of any process to see any associated Handles (an integer that identifies the process to Windows) or Modules associated with it, which is a dynamic link library (.dll) or executable (.exe) file that has been opened by the process.
 Figure 8-12. The CPU tab provides information on processes and services
For each process and service, additional information is listed, such as its long-form description, how much CPU time it is using, and the current status of the process or service, such as if it is currently suspended (highlighted in blue), running, or stopped.
When you right-click a process, you will see options to End [the] process, End [the] process tree which will also close any dependencies that have been opened by that process, and to Suspend [the] process which will pause it.
If you have a process that has hung or crashed and want to find out which other process might have called it, you can select Analyze wait chain from a right-click. This will display a tree view of the process and any processes that have called it or that it has called (see Figure 8-13). You can select one or more of the processes that appear in the dialog and click End process to terminate them.
 Figure 8-13. You can determine what processes have called others
When you click the Memory tab, you will see a long list of all the processes and services using memory, how much memory they are using, and whether they are using their own private memory address space, or if they are using a shred memory space, which can be useful for determining when processes have a memory leak occurring (see Figure 8-14).
 Figure 8-14. You can see what processes are using memory and how much
At the bottom of the panel is a simple graphic showing the proportions of memory in use and for different purposes, such as that reserved for the operating system and hardware, and how much is currently free.
The Disk tab will display information on which processes are read and writing to or performing other operations on disks and what disk they are using (see Figure 8-15).
 Figure 8-15. You can see detailed disk activity by process
Additionally, in the Disk Activity section, you can get information on specific files that are being written or read. Note though that this section won’t give you details about network shared disks, unless those disks have previously been mapped to the PC as a local drive.
Perhaps the most useful panel however is the Network tab where you can see what processes and services are using networking and how much of your bandwidth they are using (see Figure 8-16).
 Figure 8-16. The Network tab displays details of network activity
Additionally, you can see details about both local and remote TCP Connections and identify the remote IP addresses that processes are connected to, such as websites and servers, and this can be useful for identifying malware that is trying to “call home.” Lastly, the Listening Ports panel is where you can see what networking ports are being accessed and by what. If you have ports locked down on the PC for security reasons, you might find that a process is trying to access a port, and then its Firewall status will be displayed as “Blocked.”
Tip:If you want to pause the display so you can spend time drilling down into what is happening at a specific moment, select Stop Monitoring from the Monitor drop-down menu at the top of the window. This will pause all readings, giving you ample time to investigate an issue.
Event Viewer
All of this of course brings us to the big beast of Windows error reporting, the Event Viewer. First introduced with Windows NT 3.1 in 1993 it was slowly expanded upon to the point there in Windows 11 it’s a flexible and powerful tool indeed.
You open the Event Viewer either from a search in the Start Menu, from Windows Tools, or by typing eventvwr from the command line. It’s standard Microsoft Management Console (MMC) fare with a menu panel on the left side, the main information in the central panel, and context sensitive menu option in the right panel, along with a menu and a small toolbar along the top (see Figure 8-17).
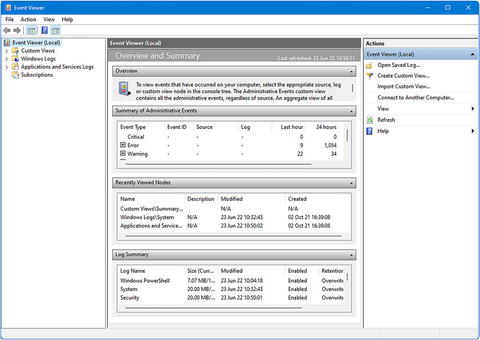 Figure 8-17. The Event Viewer is standard Microsoft Management Console fare
In the main information panel, you have three collapsible sections. Summary of Administrative events separates the event logs into type. Critical is for crashes such as Blue Screens of Death, Errors are when failures occur such as a process or service stopping or an update failing to install, Warnings are for less critical events such as a USB device failing to initiate when you plug it in, Information is for general everyday activities such as an update being installed, and Audit Success and Audit Failure cover events such as signing in to and out of the PC (see Figure 8-18). Each log type tells you how many events have been recorded in the last hour, last 24 hours, and in the last 7 days. Logs will be kept for a full 30 days though before being deleted.
 Figure 8-18. The Event Viewer splits logs by severity
The Recently Viewed Nodes section displays a list of event log areas you have recently viewed, and the Log Summary section displays common log areas.
When you expand a log category and double-click an entry, the view will change to give you all the data available for that specific log, including the total number of recorded events, with their times and dates, and a verbose description of the log (see Figure 8-19).
 Figure 8-19. Double-clicking an entry will display technical information about it
The information included will clearly vary from one entry to another, but can include the filename and disk location of the process, application, or service the log is relevant to, the user account assigned to that process or service, and a Windows error code (you can see the code 0x8007045b in Figure 8-19). There will also be an Event ID which is something we’ll need in the next section.
Creating Custom Event Views
Sometimes, you need to drill down into the event log to find specific information, such as errors associated with networking or Active Directory (AD) connections. You can do this by clicking Create custom view in the right-side panel. Doing so will open a dialog in which you can choose what you want displayed (see Figure 8-20).
 Figure 8-20. You can create custom views to filter events
It’s possible to be very specific about the data you want to collect. At the top of the dialog, you are asked when you want to collect logs from. This is used if you are collecting logs from events that have already happened in the past on the PC. Remember that logs are typically kept on a PC for a period of 30 days before being automatically deleted.
The Event level options allow you to select the severity of the events to store logs about. You may decide that you only want logs about “Critical” events or “Errors” on the PC. Then you get to choose what specific type of event you’re looking for; this is separated into two sections.
Tip:If you check the verbose option, the event logs that are stored for you will contain additional information if it is available.
By log lets you choose logs by a specific category, such as Windows Logs or Applications and Services Logs, and these can be drilled down further in categories such as Security, System, or Hardware Events. Forwarded Events can be useful if you have a PC that’s having difficulty connecting or maintaining a connection to another PC or server, as it will contain events that have been forwarded to the PC by other computers.
What is more useful however is selecting events by source. This is most useful if you already know what specific type of event you are looking for, such as a networking problem or an issue with a particular service or Windows feature. There is a list you can choose from that contains several hundred options, though bear in mind that some features such as networking, the Windows Firewall, Group Policy, and power have more than one area you can collect event data about, so you might want to select more than one option.
Tip:If you select the by log option when creating a custom view, you will also be able to select a source that is applicable to that log type.
Earlier, when we looked at event reporting, I mentioned there is an Event ID attached to many events and errors. Windows assigns these IDs to uniquely identifiable events so they can be more easily tracked and grouped. If you are going to collect errors about events that have happened in the past, you can type one or more event IDs here, separated by a comma (2,9). You can also include a range of IDs using a dash (2–9). If you want to exclude specific IDs, place a minus sign (dash) before its number (–6). Next, we have the Task category. This will not always be selectable as it only contains options that exist within the event source you have chosen, and many contain no subcategories.
You can also specify keywords to help you narrow down your event reporting further.
This doesn’t mean you can type your own keywords however, as a drop-down menu will present the available options to you, such as Audit Failure and Audit Success.
Lastly, there are options for selecting a user and a computer. The User field is for when there is more than one user account on the PC, and you are trying to determine when a specific user encounters an event. Computer is for where the computer is acting as a server and sharing resources such as folders, a printer, or storage.
When you have selected the options you need, you will be asked to give your custom view a name before saving it. The custom view will then appear in the Custom Views panel in the left side of the Event Viewer window.
With the custom view created, there are different things you can do with it. Rightclick the custom view (see Figure 8-21), and a menu of options will appear.
 Figure 8-21. You can work with and amend a custom view
If you want to amend the custom view, select Properties where you will have an option to rename it, or click the Edit Filter button to further amend what it captures.
Other useful options include Filter Current Custom View which will let you view a subset of the collected events that you define. Save All Events in Custom View As… will save the event log for that view as an .evtx file. This can be sent to a third party or support person as required and opened in the Event Viewer on their own PC.
Attaching a Task to an Event
Then you will find options to open, save, import, and copy the custom view or to Attached [a] Task to this Custom View…. Note that you can also right-click any event in the Event Viewer and attach a task to it. This can be very useful as it allows you to tell the PC to automatically perform an action when the event (this is more useful for an Error or Critical event) takes place (see Figure 8-22).
 Figure 8-22. You can attach one of three task types to an event
The three options available to you include Start[ing] a program which allows you to either run a win32 or other compatible program types, such as Windows Troubleshooter, or to run a script such as a batch file or a PowerShell cmdlet (see Figure 8-23).
 Figure 8-23. You can run a program or a script when an event occurs
You might, for example, have a specific script that will reset a component or perform another troubleshooting action that is necessary to reset the problem and get the user back to a working state with their PC. You can optionally specify any arguments to be used with the script such as Command Line switches.
Send an Email (deprecated) can be used to send an email to a support person, and you need to specify the SMTP email server address for this to work. If there is a file with information that can be sent, such as a current copy of the event log file, this can be attached (see Figure 8-24).
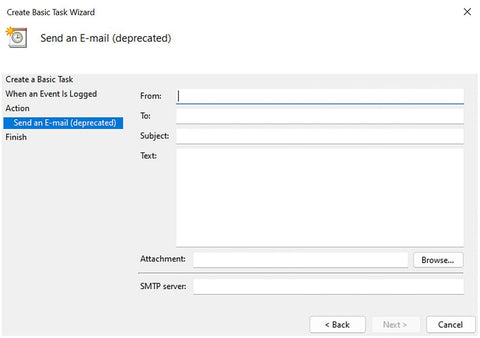 Figure 8-24. You can send an email when an event occurs
What might be more useful however when an event occurs is to Display a message (deprecated) which can be used to display a pop-up message on the user’s screen, such as “It’s happened again, please stop what you’re doing and call Tony in support.” (see Figure 8-25).
 Figure 8-25. You can display a message on the user’s screen when an event occurs
Note:I want to make a note about what deprecated means in the context of sending an email or displaying a message. This doesn’t mean the feature is being removed from Windows (though it could still disappear in a future version of the operating system). What it means though is that the feature is no longer being supported or developed further, so you should not expect new features or functionality to be added to it.
When you get to the last page of the task dialog, you will see an option at the bottom of the window to Open the Properties dialog for this task when I click Finish. Doing so will give you considerably more control over the task (see Figure 8-26).
 Figure 8-26. You can get more control over tasks with its “Properties” dialog
There are a great many options available in the task properties dialog, such as being able to specify the task should run even if the user isn’t signed in to the PC at that time, useful for events that can occur randomly in the background and for which you still need to run a program or script.
This General tab also allows you to set which user or user group the task is to be set for and whether the task needs to be run with Administrative privileges.
The Trigger tab allows you to set parameters for how and when the task will run (see Figure 8-27). You can delay the task for up to one day, repeat it if necessary after a period, stop it if it runs longer than a specified period, or set date when it should first activate or expire.
 Figure 8-27. You can set trigger parameters for a task
While the Actions tab only allows you to modify parameters you have set previously, while adding nothing new, the Conditions tab has useful options such as only running the task if the computer is plugged into the main electricity or starting running the task only when the PC has been idle for a few minutes, meaning the user is away and won’t be disturbed (see Figure 8-28).
 Figure 8-28. Tasks can be set to run when they won’t interrupt the user
There are additional Settings available such as restarting the task should it fail to run and forcing the task to stop if it itself hangs (see Figure 8-29). Lastly, the History tab will display a list of the times the task has already been run, which is useful for logging.
 Figure 8-29. Settings exist to manage hung processes in response to an event
If you later want to further edit or to delete this task, perhaps when it is no longer needed, then open the Task Scheduler from a search in the Start Menu or Windows Tools, and in the left panel, expand Task Scheduler Library before clicking Event Viewer Tasks.
Here, you will see all of your custom tasks listed, and you can edit them or delete them as needed (see Figure 8-30).
 Figure 8-30. You can manage Event Tasks in the Windows Task Scheduler
Using PowerShell with Events
If you use PowerShell scripting to manage your PCs, you can do so with the Event Log. Information can be gathered from the Event Log in Windows 11 with the command Get-EventLog -LogName System | Where-Object {$_.Eventid -eq 1074} which will display, in this example, shutdown events for the PC.
If you use the -Newest X switch, you can display the most recent (X) number of events in the log, such as Get-EventLog -LogName System -Newest 10 which, when run, displays the ten most recent system events (see Figure 8-31).
 Figure 8-31. You can access the Event Log with PowerShell
You can also use additional switches with the Get-EventLog command, including -LogName System -Newest 10 | Select-Object -Property Index, TimeGenerated, TimeWritten, EventType, Source, CategoryNumber, Message.
Useful additional commands are
- Get-EventLog -List to view event logs on the local PC
- Get-EventLog -LogName System -EntryType Error to see all error events for a specific log
- Get-EventLog -ComputerName <PCName> -LogName System to gather logs from a remote PC
- Get-EventLog -LogName System -ComputerName <PC1>, <PC2>, <PC3> to gather event data from multiple PCs
You can read more about the Get-EventLog command on the Microsoft Docs website.
The Get-WinEvent command works in a similar way to Get-EventLog but displays information differently. You can find detailed information on how it is used at the Microsoft Docs website.
While the Get-EventLog command is useful, displaying this data in the PowerShell window is far from ideal. You can export the results as a CSV file however that can be opened and read in Excel. For this, you will use the additional command | Export-Csv -Path "Path and File Name". For example, in Figure 8-32, I have used the command GetEventLog -LogName System -Newest 10 | Export-Csv -Path "E:\systemlog.csv" to export a file with details of the ten most recent system events.
 Figure 8-32. You can export Event Log data at CSV files using PowerShell
The Blue Screen of Death
When it comes to getting information from Windows, there’s nothing quite like the legendary Blue Screen of Death (BSOD), or the Blue Unhappy Emoticon of Death as I like to call it these days (see Figure 8-33). This is because this unhappy blue smiley, with just a single error message and occasionally a QR code you’d never scan before it vanished, is actually more helpful than you might think.
 Figure 8-33. The Blue Unhappy Emoticon of Death is more helpful than you think
The help doesn’t come in the form of the screen itself, that’s probably the least helpful part of the operating system (aside from the inclusion of Candy Crush obviously; Ed); it’s in the information it saves to the hard disk for you.
Open the Start-up and Recovery options which is most easily accessed by choosing System from the Windows key + X menu, then clicking the Advanced system settings link, and finally the Settings button in the Start-up and Recovery section (what can I say, Windows still needs some streamlining), and you will see some useful options (see Figure 8-34).
 Figure 8-34. Start-up and Recovery contains useful options
This is the dialog you might have traditionally gone to if you had a dual-boot setup on your PC, but it’s also where you’ll find the System failure options. These are all checked by default, but the Write debugging information section is worthy of note.
By default, it is set to Automatic memory dump which is perfectly fine, and I’ve never known anybody that ever wanted to change it. Other options do exist in its drop-down though, including Complete memory dump, so if you’re one of those people that likes “all” of the information, you can have it on a blue screen, though you might find this is information overload.
The standard option will detail all the information you need to diagnose the actual error without including a load of other information that’s not relevant.
Below this is the folder where the BSOD memory dump files will be stored, in %SystemRoot%, otherwise known as the root of the C: drive.
These memory dump files are binary data, so opening them in Notepad isn’t going to get you very far. There is software you can use to open these files however, such as some of the utilities in the Windows Driver Kit and Windows Software Development Kit.
By far, my personal favorite is a freeware utility called BlueScreenView, which you can download from the developer at NirSoft.
BlueScreenView will look for any available MEMORY.DMP files and allow you to open and read their contents (see Figure 8-35). The data contained within these files can include Windows error codes; the full disk and directory addresses and names of the process, service, DLL, or driver that has crashed; the memory area that two different processes were trying to write to if that’s what caused the crash; and the full date and time the crash occurred. BlueScreenView is a utility that every IT Pro should keep to hand.
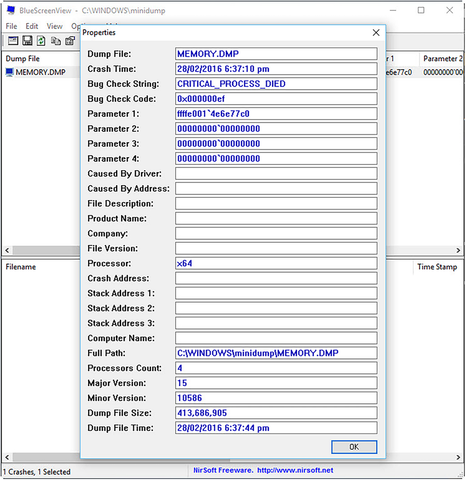 Figure 8-35. BlueScreenView lets you read the contents of Memory.dmp files
System Information
If you need more detailed and technical information about the PC and its configuration, then the System Information panel is where you want to be. Most easily found from a search in the Start Menu but it can also be run from Windows Tools.
The main view of System Information gives you overview information about the PC, including the version number of the install Windows 11 build, the model names (and or numbers) of the processor and motherboard, the manufacturer of the PC, and other information such as how much physical memory is installed (see Figure 8-36).
 Figure 8-36. System Information contains everything you need to know about a PC
In the left panel are three collapsible options. The Hardware resources section provides information about memory and any known IRQ (processor Interrupt Request) conflicts. Components strip the hardware down into its component sections, such as network, sound, printing, USB, and display, and provide technical information on each (see Figure 8-37).
 Figure 8-37. You can get technical information on hardware and drivers
This information can include memory allocated to running drivers and services, the full names and file addresses of drivers, current operating status, and even the VEN_ (vendor) and DEV_ (device) codes needed to identify USB hardware.
The Software Environment section contains everything you need to know about the current Windows 11 installation, from loaded drivers to environment variables, installed services, and startup programs to running tasks and anything currently sitting in a print queue (see Figure 8-38).
 Figure 8-38. System Information provides data on the status of the current Windows 11 installation
At the bottom of the System Information panel is a search box you can use to find specific information, but the drop-down menus contain more useful options. The View menu, for example, has a Remote computer option which you can use to view the system information of another PC on the network.
If you need to save system information data though to either read later or to send to a support person, then the File menu has an Export option. This will save the data as a text (.txt) file. The Save option alternatively will allow you to save the data as an .nfo file instead. These files will be opened directly by System Information, making it much simpler to see the data contained within.
Using PowerShell to Get System Information
If you use scripting to manage your PCs, it is possible to gather detailed information about all aspects of a PC, local or remote. Indeed, the amount of information you can gather with PowerShell and the number of commands available would fill an entire book. You should consider this section then as an introduction, and I will provide links to additional information and resources on the Microsoft Docs website where appropriate.
File and Disk Information
If you want information on the file and disk structure and for a PC, use the Get-Disk and Get-PhysicalDisk commands. The data provided by these reports can be exported to both CSV and HTML files with the additional commands | ConvertTo-Html -Title ‘Disk Information’ | Set-Content E:\DiskReport.htm and | Export-Csv -No TypeInformation -Path E:\DiskReport.csv.
If you want data on the partition structures on the local disks, use the Get-WmiObject command in the format Get-WinObject -Class Win32_LogicalDisk with the optional command | ft -AutoSize (see Figure 8-39).
 Figure 8-39. You can display partition information with the GetWmiObject command
To see information on files, you can use the command Get-WmiObject -List -Namespace ROOT\CIMV2 | Where-Object Name -Match ‘share’ | Sort-Object Name.
This command will display all shared resources on the PC. This includes disks, printers, devices, folders, and files. It is possible to get more concise information, however, and also obtain additional information on when shares were created and the maximum number of users permitted to access the share and to modify share parameters for both local and networked computers. You can read about the Win32_Share command on the Microsoft Docs website.
In the same way you can view information about shares, you can also get information about file, folder, and disk permissions. The command Get-Acl -Path C:\Windows, for example, can be used to see the Owner and Access permissions for the Windows folder on the local PC.
If we want more detailed information however, we can use the format Get-Acl -Path D:\Mike\OneDrive\Documents | Select-Object -ExpandProperty Access | Format-Table -AutoSize, as seen in Figure 8-40.
 Figure 8-40. You can get detailed information about ownership and access permissions
You will most commonly need to view this information because some permission or inheritance will be misconfigured and you’ll need to rectify it. For this, we can use the FileSystemAccessRule command, which you can read about on the Microsoft Docs website.
Set-Acl can be used in a variety of ways and on many things from files to Registry keys. You can, for example, copy the security permissions from one file to another using the following commands:
$FirstFile = Get-Acl -Path "D:\MasterFiles.txt" Set-Acl -Path "D:\SubordinateFile.txt" -AclObject $FirstFile
If you need to apply permissions to multiple files, you can do this with the following command:
$NewAcl = Get-Acl MasterFile.txt Get-ChildItem -Path "D:\Folder" -Recurse -Include "*.txt" -Force | Set-Acl -Acl Object $NewAcl
There are additional scripts available on the Microsoft Docs website I linked earlier for enabling and disabling inheritance and granting full access permissions for files and folders.
Hardware and System Information
Detailed information about hardware can be gathered using PowerShell, from the command Get-CimInstance -ClassName Win32_BIOS which can be used to display information about the UEFI (BIOS) system on a PC. This and other commands can also be used with the switches | Export-Csv -NoTypeInformation -Path D:\BiosReport.
csv to save the information to a file you can then open in Excel. You can also use the switch -ComputerName <PCName> to connect to another remote PC on the network so that you can gather data on it. To gather data on multiple remote PCs you should separate their names with a comma (,) or space. You can read more about the Win32_BIOS command on the Microsoft Docs website.
The command Get-CimInstance -ClassName Win32_ComputerSystem | Format-List -Property * will display information about the PC (see Figure 8-41), which includes technical information about the hardware. Again, and as with all the commands listed here, it can be used with the switches -ComputerName <PCName> and | Export-Csv to gather information on multiple computers on the network and to export the results to a file.
 Figure 8-41. You can view detailed information about a PC’s hardware in PowerShell
If you need information about the processor(s) in one or more PCs, you can use the commands Get-CimInstance -ClassName Win32_ComputerSystem | FormatList -Property * and Get-CimClass -Namespace Root\CimV2 -ClassName win32*processor*.
Processes and Services Information
When it comes to software, it can be useful to see what applications are installed on PCs across the network. For this, you can use the command Get-CimInstance -ClassName Win32_Product | Format-List. This displays a list of all the applications installed on the local PC (see Figure 8-42). When used with the -ComputerName <PCName> and | Export-Csv switches however, it comes into its own for diagnosing issues caused by different versions of software causing problems on specific computers.
 Figure 8-42. You can view installed software information including version numbers
We’ll look in much more detail at processes and services in Windows in Next, but as we’re talking about getting information using PowerShell, you can find information about running processes on a local or remote PC(s) with the Get-Process command. There are additional options and subcommands you can use this with to drill down into specific processes on the PC to get data about them, and you can read about these subcommands on the Microsoft Docs website.
Windows and third-party services can be interrogated the same way with the Get-Service command. You can use this command on its own to see the status of all installed services or in one of the following formats:
- Get-Service "net*" will list services that begin with set characters but continue using a wildcard.
- Get-Service -Displayname "*network*" will display services that have a specific word or term in their descriptive name.
- Get-Service -Name "net*" -Exclude "Netlogon" will search for services but exclude specific ones from the results.
- Get-Service | Where-Object {$_.Status -eq "Running"} will display a list of current running services. This can also be used with the subcommands "Stopped" and "Suspended".
You can read more about how to manage services using PowerShell on the Microsoft Docs website.
Tip:Some very useful commands for managing processes and services on a PC include Stop-Process, Start-Process, Stop-Service, Start-Service, and, perhaps one of the most useful, especially with troublesome third-party services, Suspend-Service and Restart-Service. More information on how these useful and simple commands work can be found on the Microsoft Docs website.
Summary
There is a huge amount of information you can gather about Windows 11 from the tools and utilities provided as part of the operating system, to log and dump files created by Blue Screen events, and by interrogating both local and remote PCs using PowerShell.
In the next chapter, we’ll start looking at how we utilize this information and how we troubleshoot and repair problems with the Windows operating system files and the Windows core OS (kernel) files, and we’ll look more at how to troubleshoot and manage Windows Update.