


How to Calculate Expected Value in Excel?

Do you want to take your data analysis and financial forecasting to the next level? Calculating expected value in Excel is a great way to do just that. With the help of this powerful spreadsheet program, you can quickly and accurately determine the expected value of a set of data. In this guide, we will explain what expected value is, its various uses, and how you can calculate it in Excel.
For a step-by-step tutorial:
- Open Microsoft Excel and create a new spreadsheet.
- Create a column for each variable and a row for each entry.
- Input your data into the spreadsheet.
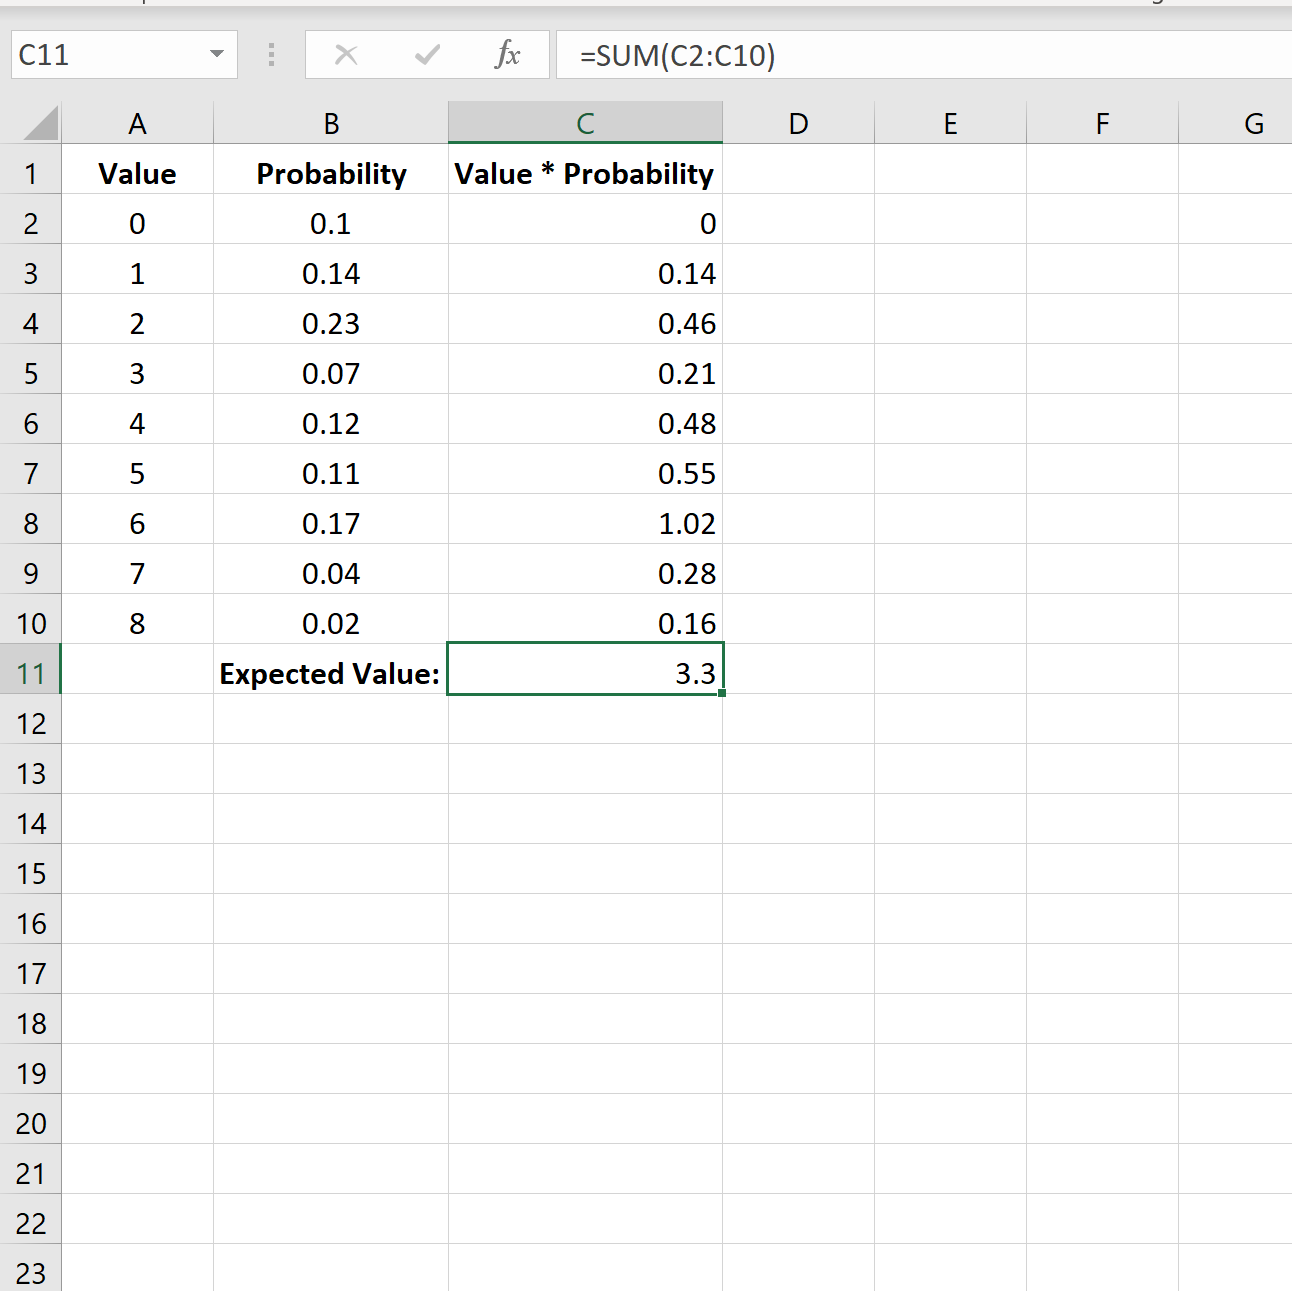
- Multiply each outcome by its probability.
- Sum the results to calculate the expected value.
How to Calculate Expected Value in Excel?
What is Expected Value?
Expected Value (EV) is a calculation used to determine the average outcome of an experiment. EV is calculated by multiplying each outcome by its probability of occurrence and then summing the products. The EV is an important concept in probability theory and decision-making. It is also known as expectation, mean, or average.
Expected Value is a useful tool when making decisions. It helps to determine the most probable outcome and allows for an informed decision to be made. EV is widely used in the fields of finance, economics, and statistics.
EV is calculated using the formula: EV = Sum (Probability of Outcome * Outcome).
How to Calculate Expected Value in Excel?
Step 1: Enter Data in Excel
The first step is to enter the data into an Excel spreadsheet. This includes the outcomes, probabilities, and the expected values to be calculated. Make sure to label the columns accordingly and that the data is accurate.
Step 2: Use the EV Formula
The EV formula is used to calculate the expected value. It is written as: =SUMPRODUCT(Probability, Outcome). The formula is entered into an empty cell and the probability and outcome columns are selected.
Step 3: Interpret the Results
The result of the calculation is the expected value. This value can be used to determine the most likely outcome of an experiment. It is a useful tool when making decisions.
Advantages of Calculating Expected Value in Excel
Ease of Use
Excel is a user-friendly program that is easy to use. It allows for the data to be entered quickly and accurately. The EV formula is simple to use and the results can be interpreted quickly.
Accuracy
Excel is an accurate program that ensures the data entered is correct. The formula used to calculate the expected value is also accurate. This ensures the results are reliable and can be used to make informed decisions.
Conclusion
Calculating expected value in Excel is a useful tool when making decisions. It is a simple and accurate process that can be completed quickly. Excel is a user-friendly program that allows for the data to be entered quickly and accurately, and the EV formula is simple to use. The results of the calculation can be used to determine the most likely outcome of an experiment.
Top 6 Frequently Asked Questions
What is the formula for calculating expected value in Excel?
The formula for calculating expected value in Excel is: =SUMPRODUCT(Probability_Range,Outcome_Range). This formula multiplies each of the probabilities in the “Probability_Range” by the corresponding outcome in the “Outcome_Range” and adds them together to calculate the expected value.
What is the expected value in Excel?
The expected value in Excel is the average value of a given outcome over a set of trials. It is calculated by multiplying each possible outcome by its probability of occurring and then summing the resulting values. The expected value can be used to help make decisions in uncertain situations, such as when playing a game of chance.
How do you enter data into the expected value formula in Excel?
When entering data into the expected value formula in Excel, the user must first enter the probability range and the outcome range. The probability range is a list of all the probabilities associated with the outcomes, with each probability listed in a separate cell. The outcome range is a list of all the possible outcomes, with each outcome listed in a separate cell. Once the probability range and outcome range are entered, the user can enter the formula =SUMPRODUCT(Probability_Range,Outcome_Range) into the cell where the expected value should be calculated.
What is an example of calculating expected value in Excel?
An example of calculating expected value in Excel is a situation where there are two possible outcomes and each has an associated probability of occurring. For example, if the first outcome has a probability of 0.5 and a value of 10, and the second outcome has a probability of 0.5 and a value of 20, the expected value can be calculated by entering the data into the formula =SUMPRODUCT(0.5,10,0.5,20), which will result in an expected value of 15.
What is the difference between probability and expected value in Excel?
The difference between probability and expected value in Excel is that probability is the likelihood of an outcome occurring, while expected value is the average value of a given outcome over a set of trials. Probability is typically expressed as a number between 0 and 1, while expected value is typically expressed as a numerical value.
What are some tips for calculating expected value in Excel?
Some tips for calculating expected value in Excel include: entering the data into the formula accurately; double-checking the formula for accuracy; and understanding the difference between probability and expected value. Additionally, it is important to ensure that the probability of all the outcomes adds up to 1, as this is a requirement for the expected value formula. Finally, it is important to remember that the expected value is not always the same as the most likely outcome.
Expected Value Excel
Expected value is a powerful tool for making decisions, and with a few simple steps, it can be calculated quickly and accurately using Excel. With this knowledge, you can make smarter decisions and have more confidence in your projections. With the right information, you can maximize the potential of your resources and make the right decision for your business.