


How to Do Forecasting in Excel?

Are you looking for ways to make forecasting easier and faster? Excel is a great tool that can help you do exactly that. This article will show you how to do forecasting in Excel, from setting up the data to using built-in formulas to make forecasting a breeze. You’ll learn how to make quick estimates, create accurate forecasts, and even visualize your data. With these tips, you’ll have the ability to turn your Excel data into meaningful forecasts and predictions.
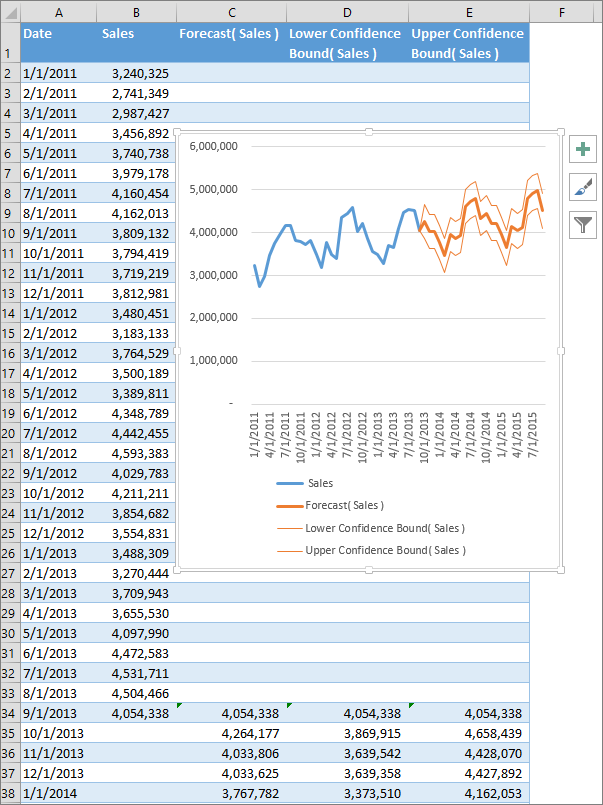
Forecasting in Excel can be done in a few easy steps:
- Open a new spreadsheet and enter the data you would like to use for forecasting.
- Go to the Data tab and click on the Forecast Sheet option.
- Choose the forecasting method you would like to use (average, trend line, etc.).
- Enter the data range and the forecast range into the dialog box.
- Click OK and your forecast will be displayed in the spreadsheet.
Introduction to Forecasting in Excel
Forecasting is an important part of managing a business as it helps in predicting future events and trends. Excel is one of the most popular software programs for forecasting. It has powerful features and tools that allow users to create accurate forecasts quickly and easily. In this article, we will discuss how to do forecasting in Excel.
Setting Up a Forecast in Excel
The first step in forecasting in Excel is to set up your data. You will need to enter your historical data into a worksheet to get a sense of the trends over time. Once you have entered the data into the worksheet, you can use Excel’s forecasting tools to create a forecast. To do this, you will need to select the data range and then click on the “Forecast” button in the Data tab. Excel will then generate a forecast based on the data you have entered.
Choosing a Forecast Type
Once you have set up your data, the next step is to choose a type of forecast. Excel offers several types of forecasts, including linear, exponential, and seasonal. Depending on the type of data you have entered, you may need to choose a different type of forecast. For example, if you have entered monthly sales data, you might want to use the seasonal forecast.
Customizing Your Forecast
Once you have chosen the type of forecast you want to use, you can then customize it to better fit your data. You can adjust the forecast range, the number of periods, and the confidence interval. You can also add a trend line to your forecast to help you visualize the data better.
Analyzing the Forecast
Once you have created your forecast, you can then analyze the results. You can use Excel’s built-in tools to compare the forecast to the actual data. This will help you to identify any discrepancies and make adjustments to the forecast. You can also use the forecast to make decisions about future actions.
Forecasting Tools in Excel
In addition to forecasting, Excel also offers several other tools that can help you manage your data. You can use the Solver tool to optimize your data and the Analysis Toolpak to analyze large data sets. The PivotTable and PivotChart tools can help you create dynamic reports and analyze trends.
Conclusion
Excel is a powerful program for forecasting. It offers a variety of tools and features that make forecasting easy and accurate. With a few simple steps, you can use Excel to set up, customize, and analyze your forecasts.
Frequently Asked Questions
What is Forecasting?
Forecasting is the process of making predictions about the future based on data collected in the present. It is an essential part of planning for any business or organization, as it allows them to anticipate any potential risks or opportunities that may arise in the future. Forecasting can be done using a variety of methods and tools, such as Excel. Excel is an easy-to-use spreadsheet application that can be used to create more complex forecasting models.
What is Excel?
Excel is a popular spreadsheet software application that is part of the Microsoft Office suite. It is a powerful tool for organizing and analyzing data, as well as creating advanced models and visualizations. It can be used to create simple tables and charts, as well as more complex models and calculations. Excel is an especially useful tool for forecasting, as it allows you to easily create forecasts with a variety of methods.
How Can Excel be Used for Forecasting?
Excel can be used for forecasting in a variety of ways. It can be used to create a variety of charts and visualizations, such as line charts, scatter plots, and histograms. Excel also has a variety of statistical functions that can be used to create more advanced forecasting models. These functions can be used to perform regression analysis, analyze time series data, and create forecasts using exponential smoothing.
What Types of Forecasts Can be Created with Excel?
Excel can be used to create a variety of different types of forecasts. These include short-term forecasts, such as weekly or monthly forecasts, as well as long-term forecasts. Excel can also be used to create forecasts for a variety of different variables, such as sales, demand, inventory, and more. Excel can also be used to create forecasts using a variety of different methods, such as linear regression, exponential smoothing, or autoregressive models.
What are the Benefits of Using Excel for Forecasting?
There are many benefits to using Excel for forecasting. Excel is an easy-to-use application that can be used to create a variety of different types of forecasts. It also has a variety of statistical functions that can be used to create more advanced models. Excel also allows for the creation of interactive charts and visualizations, which can be used to quickly identify trends and patterns in the data. Finally, Excel is a cost-effective tool that can be used to quickly create reliable forecasts.
Are There Any Limitations to Using Excel for Forecasting?
Yes, there are some limitations to using Excel for forecasting. First, Excel is limited in the types of models that it can create. For example, it cannot create more complex models such as neural networks or support vector machines. Additionally, Excel is limited in the amount of data that it can process, as it can only handle a few thousand rows of data at a time. Finally, Excel is limited in its ability to handle real-time data, as it cannot be used to create dynamic models that can quickly respond to changes in the data.
Forecasting in Excel is a great tool to forecast future performance and plan ahead. Excel provides a range of tools and functions to make forecasting easy, accurate and efficient. With a few simple steps, you can forecast sales trends, calculate inventory levels, measure the impact of marketing campaigns and more. Forecasting in Excel can help you make informed decisions and succeed in your business endeavors.