


How to Get the Standard Deviation in Excel?

Do you need to understand how to calculate the standard deviation in Excel? It’s an important statistic to know, especially if you are dealing with large data sets. Understanding how to get the standard deviation in Excel can help you analyze your data more effectively, saving you time and energy. In this article, we’ll discuss how to calculate the standard deviation in Excel and provide step-by-step instructions to make it easier for you. So, if you need to know how to get the standard deviation in Excel, keep reading to find out what you need to do.
To calculate the standard deviation in Excel, you can use the STDEV function. To use this function, enter the numbers you want to calculate the standard deviation of in a range of cells. Then, enter the STDEV function in another cell. The STDEV function will return the standard deviation of the numbers in the range of cells.
In addition, you can also use the STDEVP function to calculate the standard deviation. The STDEVP function returns the standard deviation of a population, while the STDEV function returns the standard deviation of a sample.
Alternatively, you can use the following steps to calculate the standard deviation in Excel:
- Select the range of cells that contains the numbers you want to calculate the standard deviation for.
- In the Home tab, click the arrow next to the AutoSum button, and then select the More Functions option.
- In the Insert Function dialog box, select the Statistical group from the Or Select a Category list.
- Select the STDEV or STDEVP function from the list of functions.
- Click the OK button.
- Enter the cell range that contains the numbers you want to calculate the standard deviation for.
- Click the OK button.
- The standard deviation will be returned in the selected cell.
What is Standard Deviation in Excel
Standard deviation is a statistical measure of the spread of data around the mean. It measures the amount of variation or dispersion of a set of data values within a population or sample. It is calculated by taking the square root of the variance. In Excel, standard deviation is calculated using the STDEV.P and STDEV.S functions.
The STDEV.P function is used to calculate the population standard deviation, which takes into account all values in a population. It is the most commonly used formula for standard deviation. On the other hand, the STDEV.S function is used to calculate the sample standard deviation, which takes into account a sample of the population.
How to Calculate Standard Deviation in Excel
To calculate standard deviation in Excel, you need to enter your data into a spreadsheet and then use the STDEV.P or STDEV.S functions to calculate the standard deviation.
To begin, open a blank Excel spreadsheet and enter your data into the cells. Make sure each value is separated by a comma and the data is entered in the same column. Once the data is entered, you can then use the STDEV.P or STDEV.S formulas to calculate the standard deviation.
To calculate the population standard deviation, use the STDEV.P formula. To calculate the sample standard deviation, use the STDEV.S formula. Both formulas require you to enter the range of cells containing the data. For example, if your data is in cells A1 to A10, you would enter “A1:A10” in the formula.
Using STDEV.P Function
The STDEV.P function is used to calculate the population standard deviation. To use this function, enter the following formula into a cell:
STDEV.P(range)
The range is the set of cells containing your data. For example, if your data is in cells A1 to A10, you would enter “A1:A10” in the formula.
Once you have entered the formula, Excel will automatically calculate the population standard deviation and display the result in the cell.
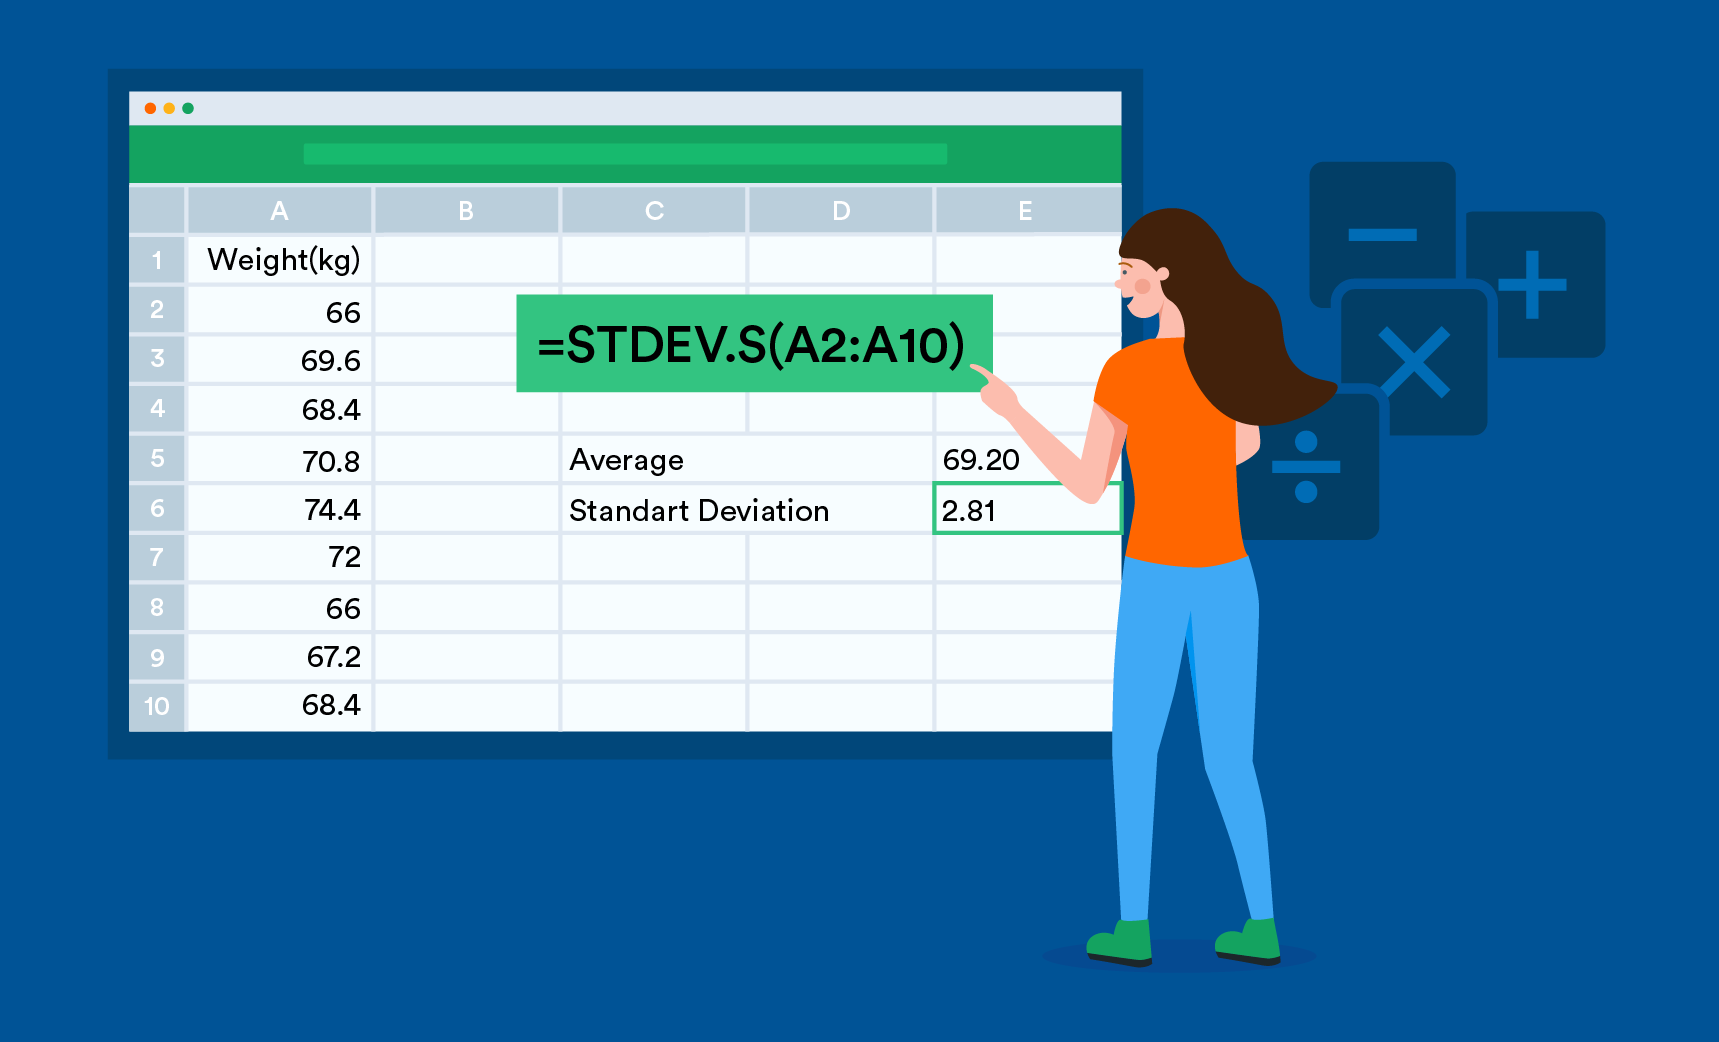
Using STDEV.S Function
The STDEV.S function is used to calculate the sample standard deviation. To use this function, enter the following formula into a cell:
STDEV.S(range)
The range is the set of cells containing your data. For example, if your data is in cells A1 to A10, you would enter “A1:A10” in the formula.
Once you have entered the formula, Excel will automatically calculate the sample standard deviation and display the result in the cell.
Interpreting Standard Deviation in Excel
Interpreting the standard deviation in Excel can be difficult, as the range of values can vary significantly. Generally speaking, a lower standard deviation indicates that the data points are closer to the mean, while a higher standard deviation indicates that the data points are more spread out.
Interpreting Population Standard Deviation
Interpreting the population standard deviation requires first understanding the range of values. Generally, the standard deviation is calculated by subtracting the mean from each data point and then taking the square root of the sum of the squares of the differences. Therefore, if the mean is 10 and the standard deviation is 5, the range of values will be from 5 (10-5) to 15 (10+5).
Interpreting Sample Standard Deviation
Interpreting the sample standard deviation is similar to interpreting the population standard deviation. However, the sample standard deviation is calculated by subtracting the mean from each data point and then taking the square root of the sum of the squares of the differences divided by one less than the number of observations. Therefore, if the mean is 10 and the sample standard deviation is 5, the range of values will be from 5 (10-5) to 15 (10+5) divided by one less than the number of observations.
Few Frequently Asked Questions
What is the Standard Deviation?
The standard deviation is a measure of spread, or variability, in a data set. It is calculated by taking the square root of the variance of the data set. It is commonly used to assess the risk of a particular investment, or to measure the volatility of a stock or portfolio. The larger the standard deviation, the greater the risk or volatility.
What is the Formula for Standard Deviation?
The formula for calculating the standard deviation of a data set is as follows:
σ = √((Σ(x-μ)²)/N)
Where:
σ = standard deviation
Σ = sum of
x = each data point
μ = mean of data set
N = number of data points
What is the Syntax for Calculating Standard Deviation in Excel?
The syntax for calculating the standard deviation in Excel is:
=STDEV(number1,
Where:
number1 = the first number or range of numbers for which you want the standard deviation
number2 = (optional) additional numbers or ranges for which you want the standard deviation
How Do I Get the Standard Deviation in Excel?
To get the standard deviation in Excel, first enter the numbers you wish to analyze in an Excel spreadsheet. Then select an empty cell, and enter the STDEV formula. The syntax for the STDEV formula is =STDEV(number1,
What is the Difference Between STDEV and STDEVP?
The STDEV and STDEVP functions in Excel are both used to calculate the standard deviation of a data set. The main difference between the two is that the STDEV function calculates the standard deviation for a sample, while the STDEVP function calculates the standard deviation for an entire population.
What is the Difference Between STDEV and VAR in Excel?
The STDEV and VAR functions in Excel are both used to measure the spread or variability of a data set. The main difference between the two is that STDEV calculates the standard deviation, while VAR calculates the variance. The standard deviation is the square root of the variance. Therefore, if you know the value of the variance, you can calculate the standard deviation by taking the square root of the variance.
“Getting the standard deviation in Excel is a great tool to have in your arsenal when working on any type of data analysis project. It allows you to quickly and accurately calculate the variance of your data set, which will provide you with more detailed insights into your data. With a few simple steps, you can easily create a standard deviation formula in Excel and easily understand the variance of your data set. With this valuable tool, you can make more informed decisions and get the most out of your data.”