


How to Make a Pie Chart in Powerpoint?
If you need to create a visually impactful presentation, using a pie chart can be a great way to present data in an easy-to-understand format. Creating a pie chart in Powerpoint is a simple task that can help you take your presentation to the next level. In this guide, we’ll walk you through the steps of creating a pie chart in Powerpoint, so you can get your data across in an engaging way.
- Open a new PowerPoint slide and click on the “Insert” tab.
- Select the “Chart” option and click on the “Pie” option.
- Enter your data into the spreadsheet.
- Choose a chart layout. Experiment with different styles.
- Change the colors and style of the chart.
- Add a title, legend, and labels to your chart.
- Save your chart and you’re done!
Creating a Pie Chart in PowerPoint
Creating a pie chart in PowerPoint is simple and straightforward. With the right tools, you can quickly and easily create a pie chart that looks professional and communicates your data in an effective way. This article will provide step-by-step instructions to help you create a stylish and professional pie chart in PowerPoint.
Choose a Chart Type
The first step in creating a pie chart in PowerPoint is to choose the right chart type. Select the ‘Insert’ tab, then select the ‘Charts’ option. From the ‘Charts’ menu, select ‘Pie’, then select the type of pie chart that best suits your needs. There are several different types of pie charts available, including doughnut, 3-D, and exploded charts.
Enter Data
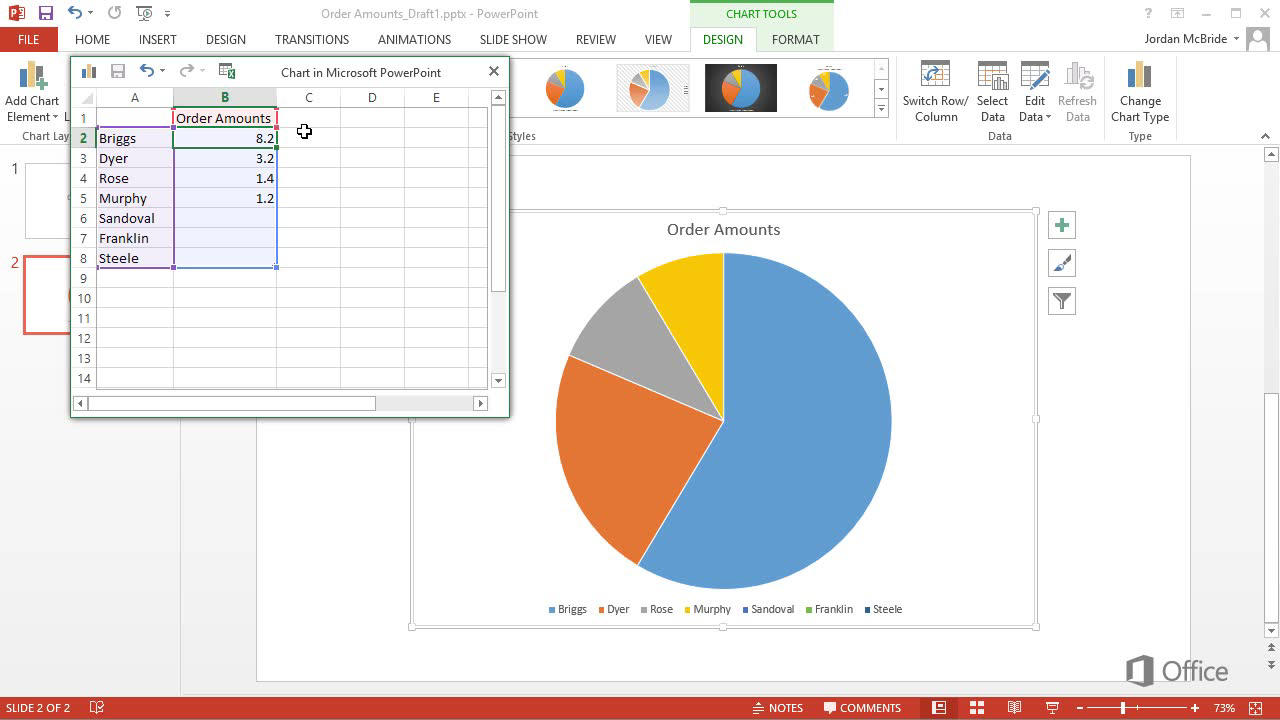
Once you have chosen a chart type, the next step is to enter the data for the pie chart. Select the ‘Design’ tab, then select ‘Edit Data’. This will open a data table that allows you to enter the data for the chart. Enter the data in the appropriate fields and click ‘OK’ when finished.
Add Labels
The next step is to add labels to the chart. Select the ‘Layout’ tab, then select ‘Data Labels’. This will open a menu that allows you to select the type of labels you want to add. Select the type of labels you want, then click ‘OK’. This will add labels to the pie chart.
Format the Chart
The final step is to format the chart. Select the ‘Design’ tab, then select ‘Chart Styles’. This will open a menu that allows you to choose from a variety of different styles. Select the style that best suits your needs, then click ‘OK’. This will format the chart to the style you have chosen.
Preview and Finalize
Once you have completed the steps above, you can preview the chart to make sure everything is correct. To do this, select the ‘View’ tab, then select ‘Slide Show’. This will open a full-screen preview of the chart. If everything looks correct, you can finalize the chart by selecting the ‘File’ tab, then selecting ‘Save’.
Related FAQ
Q1. What is a Pie Chart?
A pie chart is a type of graph that is used to compare parts of a whole. It looks like a circle that is divided into different slices, each of which represents a percentage of the whole. A pie chart is a useful tool for presenting data in a visual format and can help people better understand the data.
Q2. How Do I Create a Pie Chart in Powerpoint?
Creating a pie chart in Powerpoint is a simple process. Begin by gathering the data that you want to present in the chart. Once you have the data, open a new Powerpoint presentation and click on the Insert tab. In the Charts group, click on the Insert Pie or Doughnut Chart button. This will open the Insert Chart window, where you can select the type of chart you want to create. Then, enter the data into the chart window and click OK. The chart will be inserted into your presentation.
Q3. How Can I Add Labels to My Pie Chart?
Adding labels to a pie chart in Powerpoint is simple. After the chart has been inserted, click on the chart to select it. Then, click on the Chart Elements button to the right of the chart. Check the box next to Data Labels to add labels to the chart. You can also choose to add a legend and other elements to the chart as well.
Q4. How Do I Change the Color of My Pie Chart?
To change the color of a pie chart in Powerpoint, click on the chart to select it. Then, click on the Chart Styles button to the right of the chart. This will open a window with a variety of color options. Select the one that you want to use and the chart will be updated with the new color.
Q5. How Can I Change the Title of My Pie Chart?
Changing the title of a pie chart in Powerpoint is simple. After the chart has been inserted, click on the chart to select it. Then, click on the Chart Elements button to the right of the chart. Check the box next to Chart Title to add a title to the chart. You can then double-click on the title to change the text.
Q6. How Do I Format My Pie Chart?
Formatting a pie chart in Powerpoint is easy. After the chart has been inserted, click on the chart to select it. Then, click on the Chart Styles button to the right of the chart. This will open a window with various formatting options, such as the font, color, and size of the chart. Make the desired changes and click OK to apply the changes to the chart.
How to create a Pie chart in PowerPoint
Making a pie chart in Powerpoint is a straightforward process that can be completed in a few simple steps. By following the steps outlined above, you can create a visually appealing and informative pie chart to clearly display your data. With Powerpoint’s easy-to-navigate interface and wide range of customization options, you can create eye-catching and informative pie charts quickly and easily. So, why not give it a try today?