


How to Use Linest Function in Excel?

Are you looking to enhance your Excel skills? The LINEST function in Excel is an incredibly useful tool that can help you make the most of your data. With LINEST, you can create linear regression models, which can be used to analyze trends, predict future values, and more. In this article, we’ll discuss how to use the LINEST function in Excel, as well as the advantages and disadvantages of doing so. So, if you’re ready to take your Excel skills to the next level, read on to learn how to use LINEST in Excel!
What is the Linest Function in Excel?
The LINEST function in Microsoft Excel is a powerful tool for performing statistical analyses. It can calculate a linear regression line for a set of data points, and can also calculate additional statistics such as the standard error of the regression line, the r-squared value, the F-statistic, and the t-statistic. This makes it an invaluable tool for data analysis and forecasting.
The LINEST function is part of the Analysis ToolPak, which is an add-in for Excel. To use the LINEST function, you must first enable the Analysis ToolPak. To do this, go to the File tab and select Options. In the Options window, select Add-ins, then select Analysis ToolPak and click OK.
How to Use the Linest Function in Excel?
The LINEST function in Excel is used to calculate a linear regression line for a set of data points. To use the function, the data points must be entered into two separate columns in the Excel worksheet. The first column should contain the independent variable (the variable being predicted) and the second column should contain the dependent variable (the variable being predicted by the independent variable).
Once the data points have been entered into the worksheet, the LINEST function can be used to calculate a linear regression line. The syntax for the function is as follows:=LINEST(known_y’s, known_x’s, const, stats). The known_y’s argument is a range that contains the dependent variable data points. The known_x’s argument is a range that contains the independent variable data points. The const argument is a logical value that specifies whether the regression line should include a constant. The stats argument is a logical value that specifies whether additional statistics should be calculated.
Calculating a Linear Regression Line
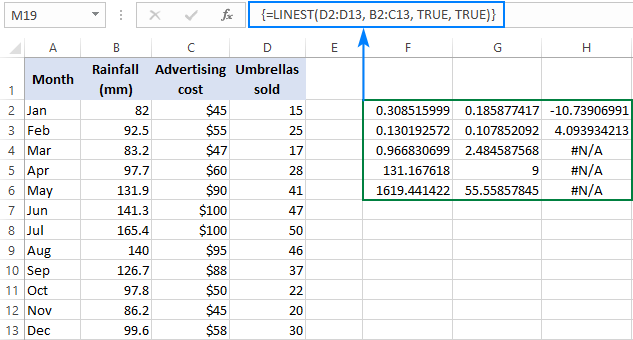
To calculate a linear regression line, select the cell in which the formula will be entered. Enter the function as follows:=LINEST(known_y’s, known_x’s, const, stats). Replace known_y’s and known_x’s with the ranges of cells containing the dependent and independent variable data points. Set the const argument to TRUE if the regression line should include a constant, or FALSE if it should not. Set the stats argument to TRUE if additional statistics should be calculated, or FALSE if they should not be calculated.
Once the function has been entered, press Enter to calculate the linear regression line. The result will be displayed in the cell as an array, which can be expanded to display all of the calculated statistics.
Using the Results of the Linest Function
The results of the LINEST function can be used to analyze the data points and make predictions about future values. The slope and intercept of the regression line can be used to calculate the value of the dependent variable for any given value of the independent variable. The r-squared value can be used to determine how closely the data points fit the regression line. The F-statistic and t-statistic can be used to test the hypothesis that the independent and dependent variables are related.
Calculating Other Statistics with the Linest Function
The LINEST function can also be used to calculate additional statistics such as the standard error of the regression line, the standard deviation of the residuals, and the degrees of freedom. To calculate these statistics, set the stats argument to TRUE. This will cause the function to return an array with all of the calculated statistics.
Limitations of the Linest Function
The LINEST function is a powerful tool for performing statistical analyses, but it does have some limitations. The function can only be used to calculate a linear regression line, and cannot be used to calculate the equation for a non-linear regression line. Additionally, the function cannot be used to calculate the correlation coefficient or the coefficient of determination. For these calculations, the CORREL function must be used.
Top 6 Frequently Asked Questions
What is the LINEST Function in Excel?
The LINEST function in Excel is a statistical function that provides information about the linear trend line of a set of data points. It uses the least squares method to calculate the line of best fit for a set of data, and then returns an array that describes the line. It can also be used to calculate the statistical properties of the line, such as the slope and intercept, as well as the correlation coefficient and standard error of the regression. The LINEST function is often used in statistical analysis and data science.
What are the Arguments for the LINEST Function in Excel?
The LINEST function in Excel has seven arguments, which are all required. The first two arguments are the arrays of known_y’s and known_x’s. These are the known y values and the known x values, respectively, of the data points used to calculate the linear trend line. The third argument is the const, which is a Boolean value that determines whether the intercept of the line should be calculated. The fourth argument is the stats, which is also a Boolean value that determines whether the additional statistical information should be returned. The fifth argument is the power, which is a Boolean value that determines whether the higher order terms of the equation should be included. The sixth argument is the y_intercept, which is an optional argument used to override the calculated y-intercept. The seventh argument is the additional_reg_argument, which is an optional argument used to specify additional regression arguments.
How to Use the LINEST Function in Excel?
To use the LINEST function in Excel, first enter the known_y’s and known_x’s as the first two arguments. The known_y’s and known_x’s should be entered as array references. Then enter the const, stats, and power arguments as Boolean values (TRUE or FALSE). The y_intercept argument is optional, and the additional_reg_arguments argument is optional. Once all the arguments have been entered, press enter to calculate the linear trend line and any additional statistical information.
What Does the LINEST Function Return in Excel?
The LINEST function in Excel returns an array of values that describe the linear trend line of the set of data points. The array consists of the slope and intercept of the line, as well as the correlation coefficient and standard error of the regression. If the stats argument is set to TRUE, it will also return the F-statistic, number of observations, degrees of freedom, and the sum of squares.
What are the Limitations of the LINEST Function in Excel?
The LINEST function in Excel is limited in that it cannot be used to calculate non-linear equations. It is also limited in that it cannot calculate the standard errors of the coefficients of the line, as this requires more complex calculations. Additionally, the LINEST function is limited to two-dimensional data; it cannot be used to calculate the trend line of three-dimensional data.
What is the Syntax of the LINEST Function in Excel?
The syntax of the LINEST function in Excel is: =LINEST(known_y’s, known_x’s, const, stats, power, y_intercept, additional_reg_arguments). The known_y’s and known_x’s should be entered as array references. The const, stats, and power arguments should be entered as Boolean values (TRUE or FALSE). The y_intercept argument is optional, and the additional_reg_arguments argument is optional. Once all the arguments have been entered, press enter to calculate the linear trend line and any additional statistical information.
The LINEEST function in Excel is an incredibly useful tool for creating linear models, and it can help streamline your data analysis. With its help, you can quickly produce accurate estimates and forecasts with minimal effort. When used properly, the LINEEST function can help you save time and make more informed decisions.