


How to Create Date Table in Power Bi Using Dax?

Are you interested in learning how to create a date table in Power BI using DAX? Data analysis is an important part of any business, and having the right tools can make a big difference in the accuracy and efficiency of the process. Power BI is an incredibly powerful business intelligence tool that allows you to create data visualizations and reports with ease. One of the most important aspects of Power BI is the ability to create a date table using DAX. In this article, we will discuss how to create a date table in Power BI using DAX. We will also discuss some tips and tricks to help make the process easier. So, if you want to learn how to create a date table in Power BI using DAX, then keep reading!
Creating a Date Table in Power BI using DAX requires a few simple steps. First, you will need to create a table containing the dates you wish to analyze. This can be done by entering the dates manually or by downloading a calendar table from the internet. Second, create a calculated column in the table to generate a unique identifier for each date. Third, create a relationship between the date table and the other tables in the data model using the date identifier. Finally, use DAX formulas to create date calculations such as quarter or month.
Introduction to Creating a Date Table in Power BI Using DAX
Power BI is a powerful Business Intelligence tool that enables users to create and use data in innovative ways. It contains features such as reporting, data modeling, data visualization, and analytics. One of the key features of Power BI is the ability to create date tables using DAX. DAX stands for Data Analysis Expressions and is a library of functions and operators that allow users to manipulate and analyze data. In this article, we will look at how to create a date table in Power BI using DAX.
Steps for Creating a Date Table in Power BI Using DAX
Creating a date table in Power BI using DAX is a relatively straightforward process. The first step is to create a new table in Power BI. To do this, select the “Data” tab from the ribbon and then click on “New Table”. This will open a new window where you can enter the data for your date table.
Once the new table is created, you can then create the date table by entering the appropriate DAX formula. The formula should include the following components: a start date, end date, and an interval. The start date is the earliest date in your date table, while the end date is the latest date. The interval is the amount of time between each date and can be specified in days, weeks, months, or years.
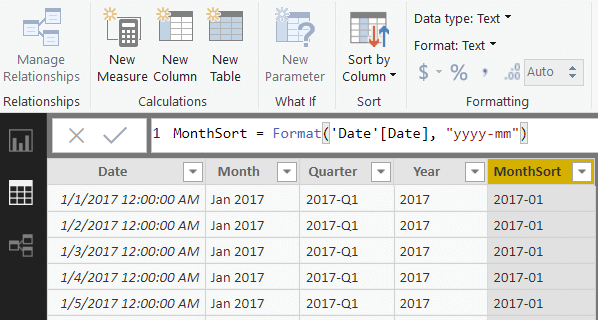
After entering the formula, you can then customize the date table by adding additional columns such as month, quarter, or year. This can be done by using the “Add Column” button in Power BI. You can also apply filters to the date table to limit the data to specific periods of time.
Using the Date Table in Power BI
Once the date table has been created, you can use it in Power BI to create visualizations. To do this, you will need to link the date table to your other data sources. This can be done by selecting the “Linked Tables” option from the ribbon and then selecting the appropriate data source. Once the data sources have been linked, you can then use the date table to create visualizations such as bar charts, line charts, and pie charts.
You can also use the date table to create calculations in Power BI. For example, you can use the date table to calculate the number of days between two dates or to calculate the average sales for a given period of time. You can also use the date table to filter your data to only show data for a specific period.
Conclusion
Creating a date table in Power BI using DAX is a relatively simple process. Once the date table has been created, it can be used to create visualizations and calculations in Power BI. It can also be used to filter data to only show data for specific periods of time. With the help of the date table, users can gain insights into their data that would otherwise be impossible to obtain.
Top 6 Frequently Asked Questions
Q1: What is the purpose of a date table in Power BI?
A date table is an essential element of data modeling in Power BI. It helps to create relationships between different data sets and is used to analyze time-based data. The date table allows us to compare data over time and create powerful visuals such as line charts, column charts, and other graphical representations of data. It is also used to create filters, slicers, and other visualizations that enable users to analyze and explore data more efficiently.
Q2: What are the important features of a Date Table?
A date table is an important feature of Power BI because it helps us to analyze time-based data more easily. The most important features of a date table are:
1. It must contain a continuous range of dates from the start date to the end date.
2. It should have a unique identifier for each day.
3. It should also contain fields such as year, quarter, month, and week.
4. It should have columns for calculating trends, such as year-over-year or quarter-over-quarter growth.
5. It should also contain columns for calculating ratios or averages, such as cost per unit or average sales.
6. Finally, it should include fields for creating custom date hierarchies or slicers, such as fiscal year or month-to-date.
Q3: How do you create a Date Table in Power BI?
Creating a date table in Power BI is a relatively straightforward process. First, you need to create a new table in the data model and add the necessary fields. This includes a unique identifier, the start date, and the end date. Next, you need to create columns for each of the desired features, such as year, quarter, month, and week. Finally, you need to add the calculated columns for trends, ratios, and custom hierarchies. Once all of the columns have been added, the table is ready to be used.
Q4: What is the role of DAX in creating a Date Table in Power BI?
DAX (Data Analysis Expression) is a language used to create calculated columns and measures in the Power BI data model. It is used to create custom date tables in Power BI, as it allows us to create calculated columns with complex logic and calculations. DAX can be used to calculate dates, calculate trends and ratios, and create custom hierarchies. In addition, DAX can be used to create calculated columns for filtering and sorting data in the data model.
Q5: How do you make sure your Date Table is working correctly?
To ensure that your date table is working correctly, it is important to test it by creating visuals and performing calculations. Start by creating a line chart to ensure that data is being plotted correctly. Then, create a slicer to verify that the date fields are being filtered correctly. Finally, use DAX to create measures and check them in a table or matrix visual to make sure that the data is being calculated correctly.
Q6: What are the benefits of using a Date Table in Power BI?
Using a date table in Power BI provides several benefits. The most important benefit is that it enables us to analyze time-based data more effectively. It also allows us to create powerful visuals such as line charts and column charts, which are useful for analyzing trends over time. Additionally, it allows us to create filters and slicers, which can be used to quickly explore data. Finally, it enables us to create custom hierarchies, which can be used to group data in more meaningful ways.
Creating a simple date table in Power BI
By following the steps outlined in this article, you can now confidently create a date table in Power BI using DAX. With a date table in place, you can now move on to more complex Power BI projects and take advantage of all the data visualization capabilities that Power BI offers. With the right setup and knowledge, you can unlock the power of Power BI to produce incredible insights from your data.