


How to optimize Performance and power management in Windows 10 windows 11?

How to optimize Performance and power management in Windows 10 windows 11?
Is there such a thing as a Windows 10 computer that meets every performance desire and expectation of its user(s)? Perhaps. After all, the system is designed to perform well straight out of the box. And yet, for many (ourselves included), performance adequacy is always a receding target. Whether you’re mainly a gamer, a video editor, a number cruncher, or a humble writer, speed thrills. More is never less; it’s always more.
The out-of-the-box performance of a Windows 10 PC should be acceptable, assuming that the device you’re using is capable of the work you’re asking it to perform. A budget laptop with a low-power mobile processor will almost certainly struggle at a CPU-intensive task like video rendering, for example. But even a workstationclass PC can perform poorly if you have a problem with a major subsystem or if Windows is configured incorrectly.
In our experience, the most common causes of poor performance (in no particular order) are these:
- Defective hardware Memory and disk errors are most obvious when they cause system crashes, but hardware-related problems can also cause performance to drag. Check with your hardware manufacturer to see what diagnostic tools are available.
- Outdated or flawed device drivers PC and device makers are responsible for supplying drivers for the individual hardware components that go into their hardware. If you do a clean install, Windows might install a generic driver instead of one written specifically for that device. We have seen performance problems vanish immediately after a simple driver upgrade. Always be certain you’re using the best possible drivers for all system devices. (Don’t assume that a newer driver is automatically better than an older one, however; any driver update has the potential to cause new problems.)
- Inadequate hardware resources Windows 10 should perform basic tasks well on even low-end hardware that was designed and built five or more years ago. But more demanding tasks, such as digital media encoding, can push some systems to the breaking point. The performance-monitoring tools we identify later in this chapter should help you identify areas where hardware resources are being overstressed.
- Out-of-control processes or services Sometimes, a program or background task that normally runs just fine will spin out of control, consuming up to 100 percent of CPU time or grabbing increasing amounts of memory or other system resources. In the process, of course, performance of all other tasks slows down or grinds to a halt. Knowing how to identify and kill this sort of process or service and prevent it from recurring is a valuable troubleshooting skill.
- Malware Viruses, Trojan-horse programs, spyware, and other forms of unwanted software can wreak havoc on system performance. Be sure to check for the possibility that malware is present on a system that exhibits otherwise unexplained performance problems.
In general, our approach to optimizing performance is prosaic. Given that there’s no magic registry setting that will suddenly send a system into warp speed, we recommend using quality parts, making sure all devices have correct and up-to-date drivers, having plenty of memory on board, maintaining enough free disk space to allow for a large paging file, having a speedy Internet connection, and keeping your system abreast of enhancements and security fixes delivered via Windows Update.
Task Manager also includes valuable performance-monitoring tools, which we describe later in this chapter. For zeroing in on performance issues with even more detail, you can use an advanced tool called Resource Monitor. In combination, these tools help you to keep an eye on CPU, memory, disk activity, and network usage.
VIEWING DETAILS ABOUT YOUR SYSTEM
For answers to basic questions about your operating system and computer, there’s no better place to start than the built-in system information tools, which display the current Windows edition and whether it is a 32-bit or 64-bit version; basic system details, including processor type and installed memory; details about the computer name and network membership (domain or workgroup); and the current activation status.
Windows 10 offers two versions of this information. On a tablet or touchscreen-enabled system, you’ll probably use the Settings app. Open Settings > System > About to display details like those shown in Figure 12-1. A faster way to get to the About page in Settings is to right-click the Start button (or press Windows key+X) and then click System.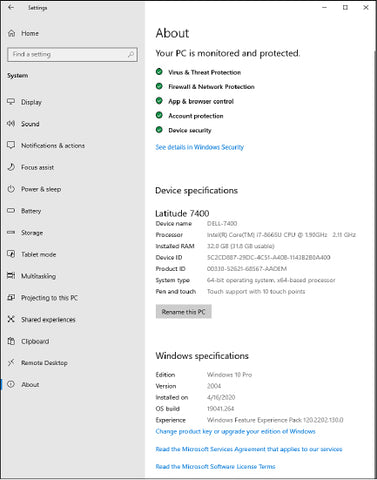
Figure 12-1 This About page, found in the Settings app, includes basic details about the local PC along with the option to change its name.
An alternative display that includes most of the same information is in the old-style Control Panel, shown in Figure 12-2. If File Explorer is open, you can bypass Control Panel to reach the same destination: right-click This PC and click Properties.
For the most exhaustive inventory of system configuration details in a no-frills text format, Windows offers three tools that provide varying levels of technical information: Systeminfo, Windows Management Instrumentation, and System Information. We describe these tools in the following sections.
Figure 12-2 The System page in Control Panel provides basic details about your computer’s configuration.
Systeminfo
Systeminfo.exe is a command-line utility that displays information about your Windows version, BIOS, processor, memory, network configuration, and a few more esoteric items. Figure 12-3 shows sample output.
To run Systeminfo, open a Command Prompt or PowerShell window, type systeminfo, and then press Enter. In addition to the list format shown in Figure 12- 3, Systeminfo offers two formats that are useful if you want to work with the information in another program: Table (fixed-width columns) and CSV (comma-separated values). To use one of these formats, append the /fo switch to the command, along with the Table or Csv parameter. You also need to redirect the output to a file. For example, to store comma-delimited information in a file named Info.csv, enter the following command:
systeminfo /fo csv > info.csv

Figure 12-3 The command-line utility Systeminfo.exe provides an easy way to gather information about all your network computers in a single database.
Using the /S switch, you can get system information about another computer on your network. (If your user name and password don’t match that of an account on the target computer, you also need to use the /U and /P switches to provide the user name and password of an authorized account.) When you’ve gathered information about all the computers on your network, you can import the file you created into a spreadsheet or database program for tracking and analysis. The following command appends information about a computer named Bates to the original file you created:
systeminfo /s Bates /fo csv >> info.csv
Windows Management Instrumentation command-line utility
This tool with the extra-long name is better known by the name of its executable, Wmic.exe. Wmic provides an overwhelming amount of information about hardware, system configuration details, and user accounts. It can be used in either of two ways.
Enter wmic from a command prompt, and the utility runs in console mode, wherein you can enter commands and view output interactively. Alternatively, you can add global switches or aliases, which constrain the type of output you’re looking for, and see the output in a Command Prompt window or redirect it to a file. For example, use the following command to produce a neatly formatted HTML file:
wmic qfe list brief /format:htable >
%temp%\hotfix.html
You can then open that file in a web browser to see a list of all installed updates on the current system. To see the full syntax for Wmic, open a Command Prompt window and type wmic /?. You’ll find official documentation for how to use this tool, including a list of aliases, verbs, switches, and commands, at https://bit.ly/wmic-syntax.
System Information
System Information—often called by the name of its executable, Msinfo32.exe—is a techie’s paradise. It displays a wealth of configuration information in a simple tree-and-details arrangement, as shown in Figure 12-4. You can search for specific information, save information, view information about other computers, and even view a list of changes to your system.
Figure 12-4 System Information is for viewing configuration information only; you can’t use it to configure settings.
To start System Information, begin typing system information in the search box or type msinfo32 at a command prompt.
You navigate through System Information much as you would through File Explorer: Click a category in the left pane to view its contents in the right pane. To search for specific information, use the Find What box at the bottom of the System Information window. (If the Find bar is not visible, press Ctrl+F, or click Edit and then clear the check box next to Hide Find.)
The Find feature is basic but effective. Here are a couple of things you should know:
- Whenever you type in the Find What box to start a new search, Find begins its search at the top of the search range (which is the entire namespace unless you select Search Selected Category Only) —not at the current highlight.
- Selecting Search Category Names Only causes the Find feature to look only in the left pane. When this check box is cleared, the text in both panes is searched.
Using the System Information tool, you can preserve your configuration information—which is always helpful when reconstructing a system—in several ways:
- Save the information as an .nfo file. You can subsequently open the file (on the same computer or on a different computer with System Information) to view your saved information. To save information in this format, click File, Save. Saving this way always saves the entire collection of information.
- Save all or part of the information as a plain-text file. To save information as a text file, select the category of interest and click File, Export. To save all the information as a text file, select System Summary before you export it.
- You can print all or part of the information. Select the category of interest; click File, Print; and be sure that Selection is selected under Page Range. To print everything, select All under Page Range—and be sure to have lots of paper on hand. Depending on your system configuration and the number of installed applications, your report could top 100 pages. (Even better, consider “printing” to PDF and saving the results.)
Regardless of how you save your information, System Information refreshes (updates) the information immediately before processing the command.
MANAGING SERVICES
A service is a specialized program that performs a function to support other programs. Many services operate at a low level (by interacting directly with hardware, for example) and need to run even when no user is signed in. For this reason, they’re often run by the System account (which has elevated privileges) rather than by ordinary user accounts. In this section, you’ll learn how to view installed services; start, stop, and configure them; and install or remove them. We’ll also take a closer look at some services used in Windows 10 and show you how to configure them to your advantage.
For the most complete view of services running on your computer, use the Services console. You can also view running services and perform limited management functions by using Task Manager. In this section, we discuss both tools.
Using the Services console
You manage services with the Services snap-in (Services.msc) for Microsoft Management Console, shown in Figure 12-5. To view this snap-in, type services in the search box and then click the Services desktop app at the top of the results list. (You must have administrator privileges to gain full functionality in the Services console. Running it as a standard user, you can view service settings, but you can’t start or stop most services, change the startup type, or make any other configuration changes.)
Figure 12-5 Use the Services console to start, stop, and configure services.
The Extended and Standard views in the Services console (selectable by clicking a tab near the bottom of the window) have a single difference: The Extended view provides descriptive information of the selected service in the space at the left edge of the details pane. This space also sometimes includes links for starting, stopping, or pausing the selected service. Unless you need to constrain the console display to a small area of your screen, you’ll probably find the Extended view preferable to the Standard view.
The Services console offers plenty of information in its clean display. You can sort the contents of any column by clicking the column title, as you can with similar lists. To sort in reverse order, click the column title again. In addition, you can do the following:
- Start, stop, pause, resume, or restart the selected service, as described in the following section.
- Display the properties dialog box for the selected service, in which you can configure the service and learn more about it.
Most essential services are set to start automatically when your computer starts, and the operating system stops them as part of its shutdown process. A handful of services that aren’t typically used at startup are set with the Automatic (Delayed Start) option, which starts the associated service two minutes after the rest of startup completes, making the startup process smoother. The Trigger Start option allows Windows to run or stop a service as needed in response to specific events; the File History service, for example, doesn’t run unless you enable the File History feature.
But sometimes you might need to manually start or stop a service. For example, you might want to start a seldomused service on the rare occasion when you need it. (Because running services requires system resources such as memory, running them only when necessary can improve performance.) On the other hand, you might want to stop a service because you’re no longer using it. A more common reason for stopping a service is because it isn’t working properly. For example, if print jobs get stuck in the print queue, sometimes the best remedy is to stop and then restart the Print Spooler service.
Starting and stopping services
Not all services allow you to change their status. Some prevent stopping and starting altogether, whereas others permit stopping and starting but not pausing and resuming. Some services allow these permissions to only certain users or groups. For example, most services allow only members of the Administrators group to start or stop them. Which status changes are allowed and who has permission to make them are controlled by each service’s discretionary access control list (DACL), which is established when the service is created on a computer.
To change a service’s status, select it in the Services console. Then click the appropriate link in the area to the left of the service list (if you’re using the Extended view and the link you need appears there). Alternatively, you can use the Start/Stop/Pause/Restart controls on the toolbar or right-click and use the corresponding command.
You can also change a service’s status by opening its properties dialog box and then clicking one of the buttons on the General tab. Taking the extra step of opening the properties dialog box to set the status has only one advantage: You can specify start parameters when you start a service by using this method. This is a rare requirement.
Configuring services
To review or modify the way a service starts up or what happens when it doesn’t start properly, view its properties dialog box. To do that, double-click the service in the Services console. Figure 12-6 shows an example.
Figure 12-6 Specify a service’s startup type on the General tab, where you can also find the actual name of the service (in this case, BTAGService) above its display name.
Setting startup options
On the General tab of the properties dialog box (shown in Figure 12-6), you specify the startup type:
- Automatic (Delayed Start) The service starts shortly after the computer starts in order to improve startup performance and user experience.
- Automatic The service starts when the computer starts.
- Manual The service doesn’t start automatically at startup, but it can be started by a user, program, or dependent service.
- Disabled The service can’t be started.
The Trigger Start option cannot be configured manually from the Services console. Instead, you have to use SC (Sc.exe), a command-line program that communicates with the Service Control Manager. If you’d rather not tinker with the arcane syntax of this command, try the free Service Trigger Editor, available from Core Technologies Consulting, at https://bit.ly/servicetriggereditor.
You’ll find other startup options on the Log On tab of the properties dialog box, as shown in Figure 12-7.
Figure 12-7 On the Log On tab, you specify which user account runs the service.
Specifying recovery actions
For various reasons—hardware not operating properly or a network connection being down, for example—a service that’s running smoothly might suddenly stop. By using settings on the Recovery tab of the properties dialog box, you can specify what happens if a service fails. Figure 12- 8, for example, shows the default settings for the Bluetooth Audio Gateway service.
Figure 12-8 Use the Recovery tab to specify what happens if a service fails.
You might want to perform a different action the first time a service fails than on the second or subsequent failures. The Recovery tab enables you to assign a particular response to the first failure, the second failure, and all subsequent failures, from among these options:
- Take No Action The service gives up trying. In most cases, the service places a message in the event log. (Use of the event log depends on how the service was programmed by its developers.)
- Restart The Service The computer waits for the time specified in the Restart Service After box to elapse and then tries to start the service.
- Run A Program The computer runs the program you specify in the Run Program box. For example, you could specify a program that attempts to resolve the problem or one that alerts you to the situation.
- Restart The Computer Drastic but effective, this option restarts the computer after the time specified in the Restart Computer Options dialog box elapses. In that dialog box, you can also specify a message to be broadcast to other users on your network, warning them of the impending shutdown.
Viewing dependencies
Many services rely on the functions of another service. If you attempt to start a service that depends on other services, Windows first starts the others. If you stop a service upon which others are dependent, Windows also stops those services. Before you either start or stop a service, therefore, it’s helpful to know what other services your action might affect. To obtain that information, go to the Dependencies tab of a service’s properties dialog box, as in the example shown in Figure 12-9.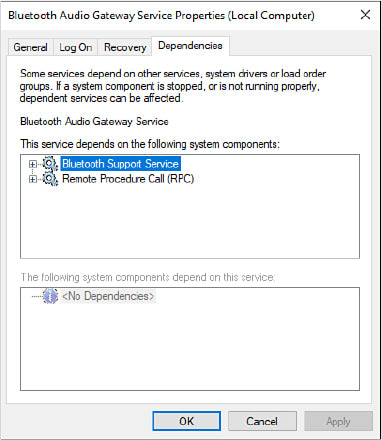
Figure 12-9 The Dependencies tab shows which services depend on other services or drivers.
The outline controls in the Dependencies tab can be expanded to show dependents of the dependents.
Managing services from Task Manager
Using the Services tab in Task Manager, you can start and stop services and view several important aspects of the services, both running and available, on your computer. You can also use this tab as a shortcut to the Services console.
To open Task Manager, use any of the following techniques:
- Press Ctrl+Shift+Esc.
- Right-click Start (or press Windows key+X), and then click Task Manager on the Quick Link menu.
- Right-click the taskbar, and then click Task Manager.
- Press Ctrl+Alt+Delete, and then click Task Manager.
The Services tab is shown in Figure 12-10.
Figure 12-10 By sorting on the Group column, you can see groups of related services together.
To start, stop, or restart a service, right-click its name on the Services tab and then click Start, Stop, or Restart.
Using the Services tab, you can also associate a running service with its process identifier (PID) and then further associate that PID with other programs and services being run under that PID. For example, Figure 12-10 shows four services running with PID 564. Right-clicking one of the services with PID 564 gives you several choices, including one to stop the service and one called Go To Details. Clicking the latter opens the Details tab in Task Manager with the particular process (typically, Svchost.exe) highlighted.
Determining the name of a service
As you view the properties dialog box for different services, you might notice that the service name (shown at the top of the General tab) is often different from the name that appears in the Services console (the display name) and that neither name matches the name of the service’s executable file. (Many services run as part of a service group, under Services.exe or Svchost.exe.) The General tab (shown earlier in Figure 12-6) shows all three names.
So how does this affect you? When you work in the Services console, you don’t need to know anything other than a service’s display name to find it and work with it.
But if you use the Net command to start and stop services from a Command Prompt window, you might find using the actual service name more convenient; it’s often much shorter than the display name. You’ll also need the service name if you’re ever forced to work with a service’s registry entries, which can be found in the HKLM\System\CurrentControlSet\Services\service subkey (where service is the service name).
And what about the executable name? You might need it if you have problems running a service; in such a case, you need to find the executable and check its permissions. Knowing the executable name can also be useful, for example, if you’re using Task Manager to determine why your computer seems to be running slowly. Although the Processes tab and the Services tab show the display name (under the Description heading), because of the window size it’s sometimes easier to find the more succinct executable name.
MONITORING PERFORMANCE WITH TASK MANAGER
The Performance tab of Task Manager gives you a quick overview of your system’s performance as measured in multiple dimensions, including CPU, memory, disk, and network usage. The small thumbnail graphs at the left report current data in real time; clicking any of these thumbnails displays a much larger version, with additional information below the chart. Figure 12-11 shows the performance data for a desktop PC, roughly 50 seconds after opening Task Manager.
Figure 12-11 The Performance tab of Task Manager gives you a big-picture view of resource usage.
The graphs to the right show 60 seconds’ worth of data, with updates at one-second intervals. In Figure 12-11, for example, the CPU graph shows a large spike caused by opening Task Manager, followed by several smaller spikes as other activities make demands on the CPU.
By keeping this pane open as you work, you can see what the impact of a given activity is. For example, you might monitor CPU usage when encoding a video file to see whether the operation pins CPU usage at 100 percent; if so, that might be evidence that you need to consider upgrading your PC to one with a more powerful CPU that’s capable of doing the same work faster, generating less heat and allowing you to do other things while the task completes in the background.
The Memory option offers a snapshot of memory usage, as shown in Figure 12-12. Note that the total amount of memory is visible above the graph, with details about the physical memory itself (number of sticks and slots, for example) below, alongside the amount of RAM in use and the amount available.
Figure 12-12 Use the Memory option on the Performance tab to see how much of your system’s RAM is in use. If the value is at 100 percent, it’s time to close some apps to improve performance.
On this page, a detailed Memory Composition bar chart appears below the main graph. At first glance, it appears to be just an alternate view of the main Memory Usage chart, but hover the mouse pointer over any segment to see its real purpose. The ScreenTips that appear over each segment explain what each one represents.
There’s a fair amount of technical detail on the Memory page, and collectively it offers a detailed picture of the total virtual address space, which includes physical memory and the paging file; in practice, that means Windows can commit more memory for use by processes than is physically available, moving pages of memory that haven’t been used recently to the paging file, which is usually located on the system disk.
That’s not the only use of the paging file, however, which is also used to save crash dump reports when Windows encounters an error. Longtime Windows users might be tempted to change the location or the size of the paging file to improve performance. In our experience, that’s rarely a good idea, and we caution against doing so. The default settings for the paging file allow Windows to manage its size and location. Moving the paging file to a secondary drive is unlikely to produce any noticeable performance gains, nor will changing the size of the paging file manually accomplish anything except in extremely specialized configurations.
The Disk options, likewise, graph the performance of all nonremovable disks on the current system. Each disk gets its own entry on the left side, with details about the selected disk’s performance on the right, as shown in Figure 12-13. The top graph depicts the percentage of time the disk is busy processing read or write requests; the bottom graph shows the disk transfer rate.
Figure 12-13 The Disk options in Task Manager let you see the throughput of a fixed disk and determine whether a particular activity is causing a bottleneck.
USING RESOURCE MONITOR TO PINPOINT PERFORMANCE PROBLEMS
Like the Performance tab in Task Manager, Resource Monitor gives you both instantaneous and recent-history readouts of key performance metrics. Also like Task Manager, Resource Monitor can show you, in excruciating detail, what each process is doing.
To open Resource Monitor, you can search for it from the Start menu or use its command line, perfmon /res, from a Command Prompt window. But the fastest way is to click the link at the bottom of the Task Manager Performance tab. This is, in our opinion, the preferred way to use this utility. Start with a quick overview from Task Manager, and if you need more information, call on Resource Monitor.
When you first open Resource Monitor, you see the Overview tab shown in Figure 12-14, which provides both detailed tables and charts that summarize performance in four areas.
Figure 12-14 Use the check boxes in the top section of Resource Monitor to limit the results to a specific process. ScreenTips show details for files that are truncated in the list below.
Using the tabs along the top of the Resource Monitor window, you can switch to a different context and focus on a specific type of resource usage. The basic layout of each tab is similar and consists of a handful of common elements.
One or more tables contain details about the resource featured on that tab. The first table on each tab is called the key table; it contains a list of all processes currently using the selected resource, with a check box to the left of each process you use to filter the data displayed in additional tables on the tab. The key table at the top of the Overview tab lists all running processes in a display that is similar to the Processes tab of Task Manager. Resource Monitor is overkill for most performance troubleshooting tasks. But it shines when you want to see exactly which process or file is responsible for an unexplained burst of activity.
POWER MANAGEMENT ON DESKTOP SYSTEMS
Power-management features in Windows 10 can be broadly divided into two groups. Features in the first group apply universally to all Windows devices, even those that are permanently tethered to AC power. Allowing a PC or tablet to sleep or hibernate cuts the amount of power it consumes, which translates into monetary savings for you and a benefit for society at large.
For portable devices—including notebooks, hybrid devices, and tablets—paying attention to power management has additional productivity benefits. Anything you do to extend the battery life of a portable device helps you avoid having to quit working because your battery gave up the ghost. We discuss power management on portable systems elsewhere in this book.
As with several other Windows features, the transition of power-management settings from the traditional Control Panel to the modern Settings app is not yet complete. Figure 12-15 shows the simple Power & Sleep page at Settings > System on a desktop PC (if this were a notebook PC, each setting would include options for managing power settings when running on battery). Two options here specify the amount of idle time before the screen goes dark and the amount of time before the system goes to a lower-power setting called sleep.
Figure 12-15 On this page, at Settings > System > Power & Sleep, you can set basic power parameters for a desktop computer.
Clicking the Additional Power Settings link on the Power & Sleep page in Settings opens the Power Options page in Control Panel, where you’ll find an extensive selection of power settings, some extremely esoteric.
The old-school Power Options page in Control Panel, shown in Figure 12-16, is based on power plans, which represent a collection of saved settings. With older versions of Windows, it was common to find at least three power plans, with a hardware maker sometimes defining its own plan as well. In the Windows 10 era, you’re likely to find only one or two. This example includes a Balanced plan and a Power Saver plan.
Figure 12-16 Default power options in Windows 10 include one or more power plans. You can create additional plans for special purposes.
Initially, Windows provides one or more power plans: Balanced is the sole option on most modern devices, but you might also see Power Saver and High Performance. (Click Show Additional Plans to see additional plans.)
The recommended Balanced plan darkens the screen after ten minutes and sends the system into sleep mode after 30 minutes. (Note that original equipment manufacturers might change the names or parameter settings for these plans.) You can tailor any plan to your liking by clicking Change Plan Settings or by clicking one of the links at the left side of the screen.
For each option, the choices in the drop-down menu range from 1 minute (probably more annoying than most people will accept) to 5 hours (useful if you want the computer to sleep only when you’re away for a long time). To disable either option, choose Never from the drop-down menu.
You can create a new plan altogether (while keeping the original plans provided by Windows or your device maker) by clicking Create A Power Plan on the left side of the screen. Doing so takes you to the Create A Power Plan page, shown in Figure 12-17.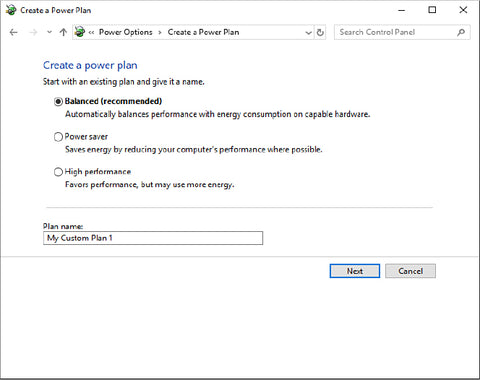
Figure 12-17 On the Create A Power Plan page, you can modify an existing plan or create a new one from scratch.
The Power Saver plan is set to turn off the display after 5 minutes and put the computer to sleep after 15 minutes. The High Performance plan is set by default to go dark at 15 minutes and never go to sleep. This might be the right choice for a system that must always be on alert. (Returning from a screen-darkened state is quick; returning from sleep takes a little longer.)
To create a new power plan, start with one of the existing ones, provide a name or accept the default name My Custom Plan 1, and then click Next. After clicking Next, you will find the usual Display and Sleep controls.
Click Create to begin the customization process. On the next page, you will see an option called Change Advanced Power Settings. Click here to arrive at the dialog box shown in Figure 12-18.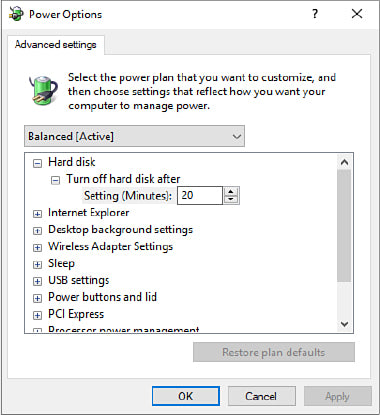
Figure 12-18 These advanced options give you granular control over power-management settings in Windows 10.
The options on the Advanced Settings tab, which are tailored to your hardware and software environment, provide a great deal of finely detailed control over powerrelated events. Click the outline controls to explore the choices available to you.
One of the options on the Advanced Settings page lets you tailor the behavior of your computer’s power button. You can also do this by clicking Choose What The Power Buttons Do on the main Power Options page in Control Panel, shown earlier in Figure 12-16. Following this path brings you to the page shown in Figure 12-19.
Figure 12-19 Drop-down menu controls on this page govern your system’s behavior in response to pressing the power button or sleep button.
The drop-down control associated with the power button gives you the following choices:
- Do nothing
- Sleep
- Hibernate
- Shut down
- Turn off the display
The same options, with the exception of Shut Down, are available for your computer’s sleep button. Note that in sleep, your computer continues to use a small amount of power; in hibernate, open files and information concerning the state of your system are written to a file on disk, and the computer shuts down almost entirely. (A small amount of power remains available to your keyboard, enabling you to emerge from hibernation by pressing a key, if that option is enabled for the device.) Hibernation reduces power consumption to an absolute minimum, but restarting from this state takes longer than waking from sleep.
The four check boxes at the bottom of the page shown in Figure 12-19 cover a miscellany of settings. Changing any of these requires an administrator’s credentials. Click Change Settings That Are Currently Unavailable to make the check boxes selectable. The settings are as follows:
Turn On Fast Startup (Recommended) This option, on by default, results in slightly quicker startups. The system accomplishes this by writing an image of the Windows kernel and loaded drivers to disk when you shut down.
Sleep This one is also enabled by default. If for some reason you’d rather not have the Sleep command appear when you click Power on Start, clear the box.
Hibernate This option, not set by default, puts Hibernate on Start’s Power menu. If you want to hibernate occasionally but don’t want to alter the behavior of your sleep or power button, you’ll need this menu option.
Lock The account picture menu is the menu that pops up when you click your account picture in the column at the left edge of Start. Lock, equivalent to pressing Windows key + L, normally is on the menu. Use this check box if you want to remove it.
Configuring power options from the command line
If your work entails managing power settings for multiple systems and users, you’ll find the powercfg command-line utility invaluable. With powercfg, you can query and set power schemes and parameters, export power settings to a file, import the file on remote systems, and more. (Many powercfg actions work only in an elevated Command Prompt window.) Even if your concerns are only with your own systems, you might find powercfg /batteryreport, powercfg /energy, and powercfg /sleepstudy useful. These commands generate reports that are not available via the interactive power-management features described earlier in this section.
To generate a list of commands available with powercfg, open a Command Prompt window and type powercfg /?. For syntax details and usage examples of any powercfg command, type powercfg /? command.